Open Source - Real User Monitoring system.
Track your users' behavior and website performance in real-time with our open-source RUM system.

Track your users' behavior and website performance in real-time with our open-source RUM system.

Advanced metrics, see where your users are coming from.
Reach out via email or web for any assistance you need.
99.99% Uptime
Monitor your application's activity in real-time. Instantly identify potential issues.
Basicrum brings simplicity and the power of open source to real user monitoring.

Basicrum is performance oriented from get go. Ready to handle high traffic.
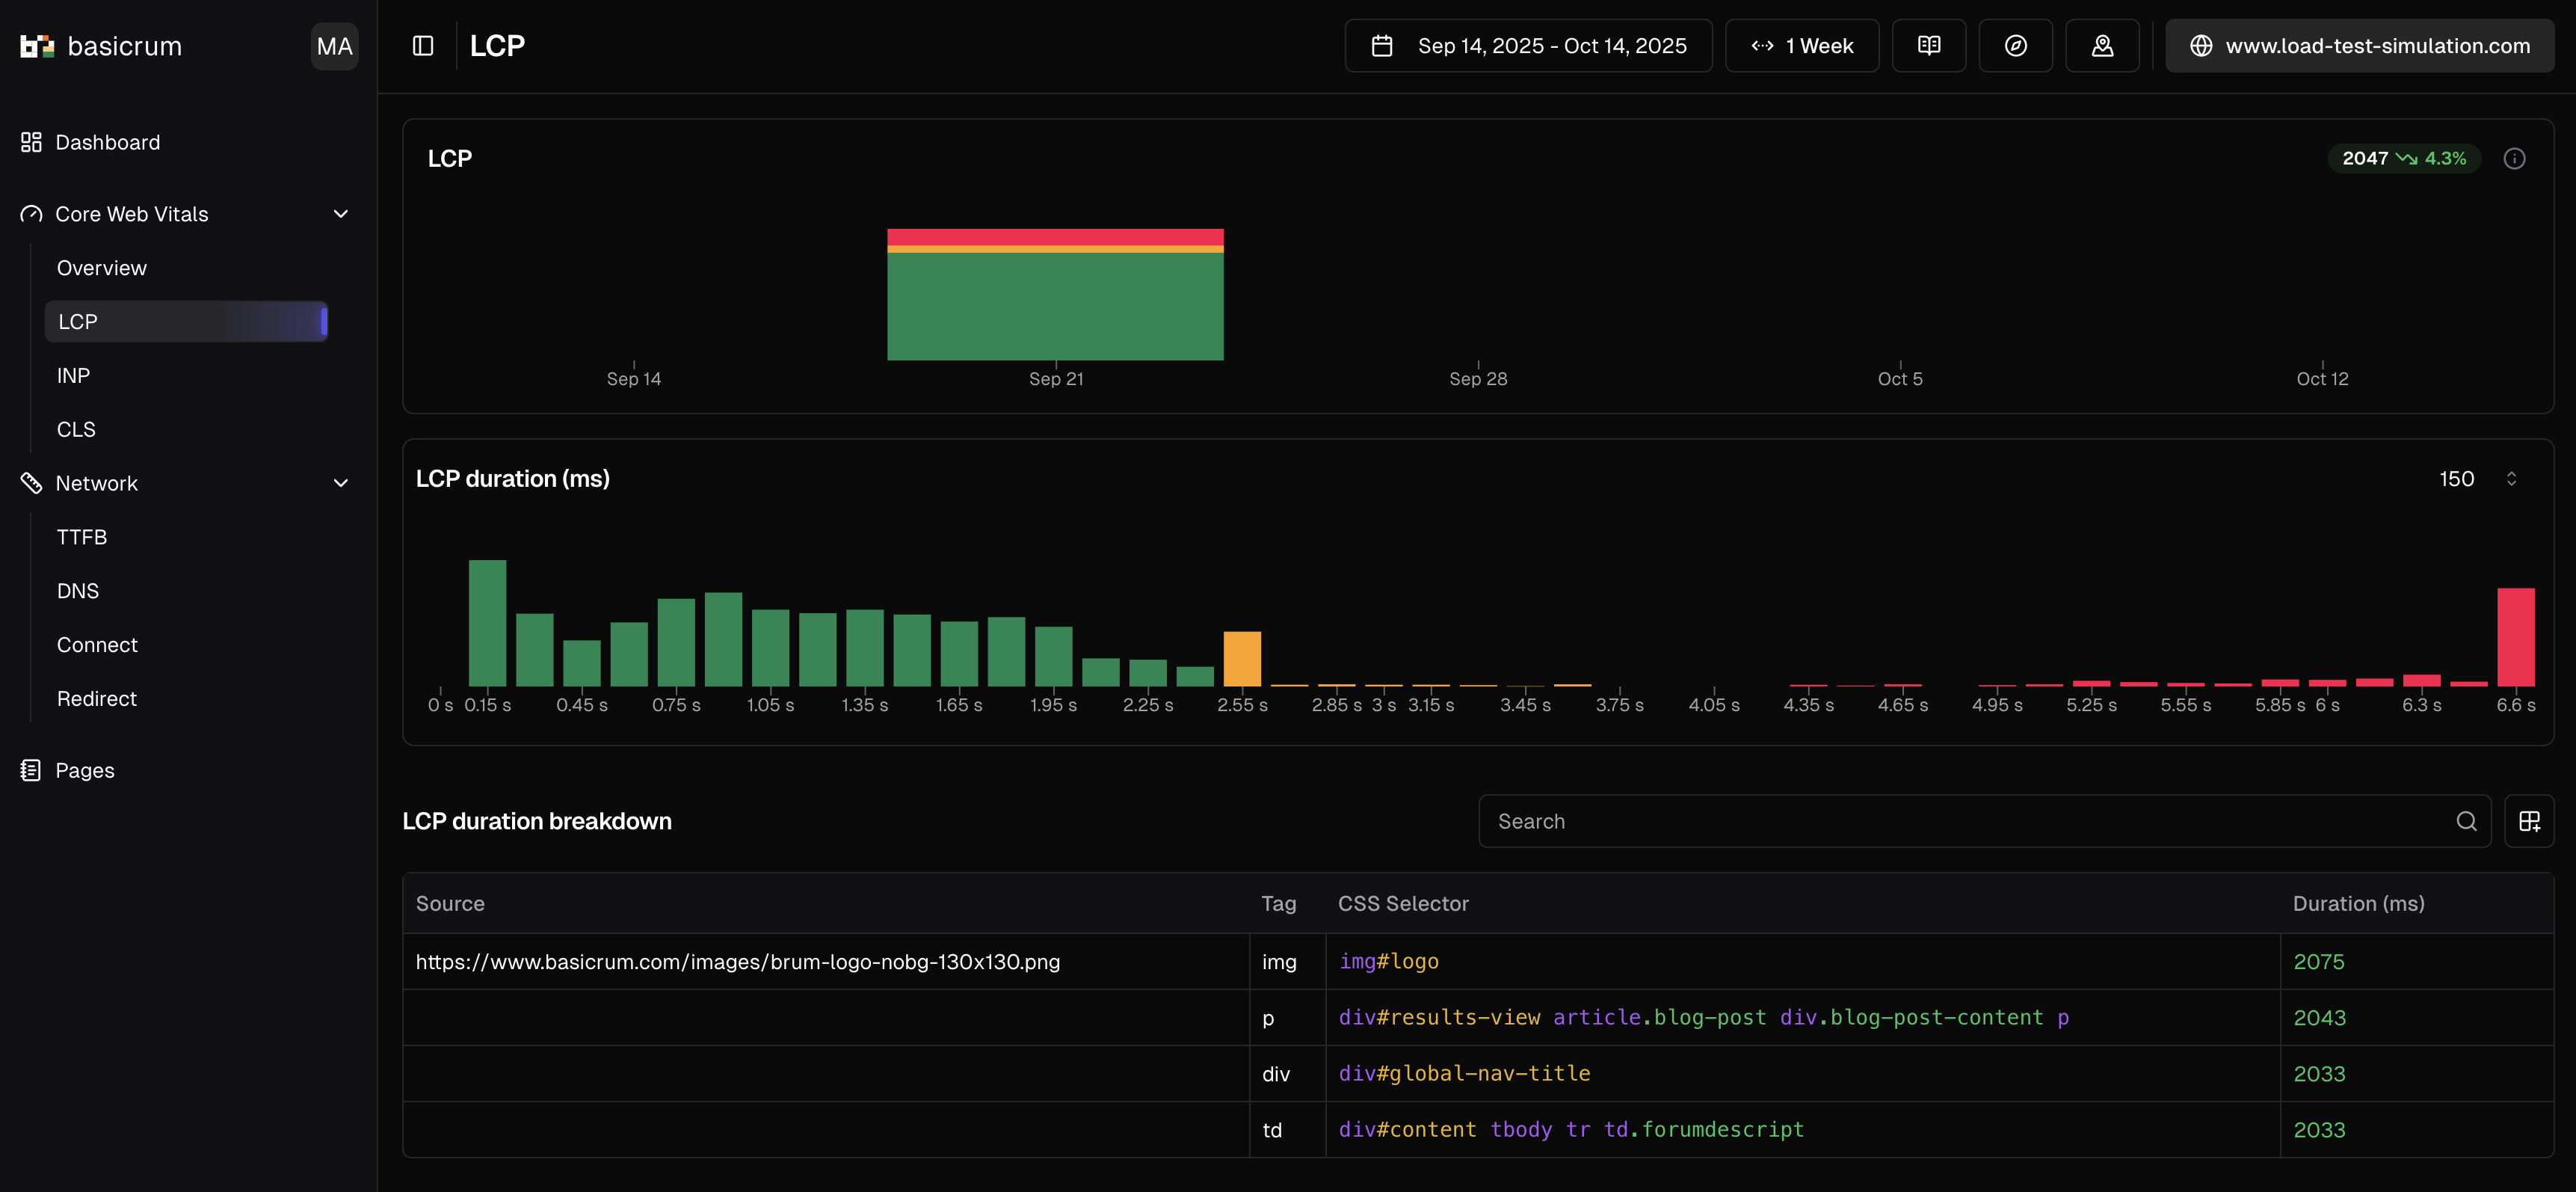
Shipped with a powerful dashboard and a set of widgets to help users monitor their users effectively.
Hosted in EU and GDPR compliant
We use RAG to help users facilitate LLMs to extract more fine grained information
Basicrum is open source and free to use. You can self host it or use our hosted version.
The app is lightweight and easy to install. It runs on any server with Node.js.
We host exclusively in the EU and comply with GDPR regulations.
Basicrum is powered by Clickhouse, a fast open-source OLAP database management system.
Sign up for Basicrum