Dimensions and Breakdowns for Real User Monitoring
Introducing Dimensions and Breakdowns in Basicrum.
Our latest feature helps us understand how different visitors experience the same website. Aka. “Different visitors. Different experiences.”
Earlier this week, we released “Dimensions”, a feature that allows Basicrum customers to drill down into the data and find performance bottlenecks.
Today, “Dimensions” enables users to view the distribution of the data in breakdown tables.
We start with 4 dimensions:
- Page Type
- Country
- Browser
- Device Type
We plan to add more dimensions, including Landing Page, Navigation Type, Operating System, and LCP element.
How does it work?
The screenshot below is from live data from calendar.perfplanet.com, a WordPress blog about web performance.
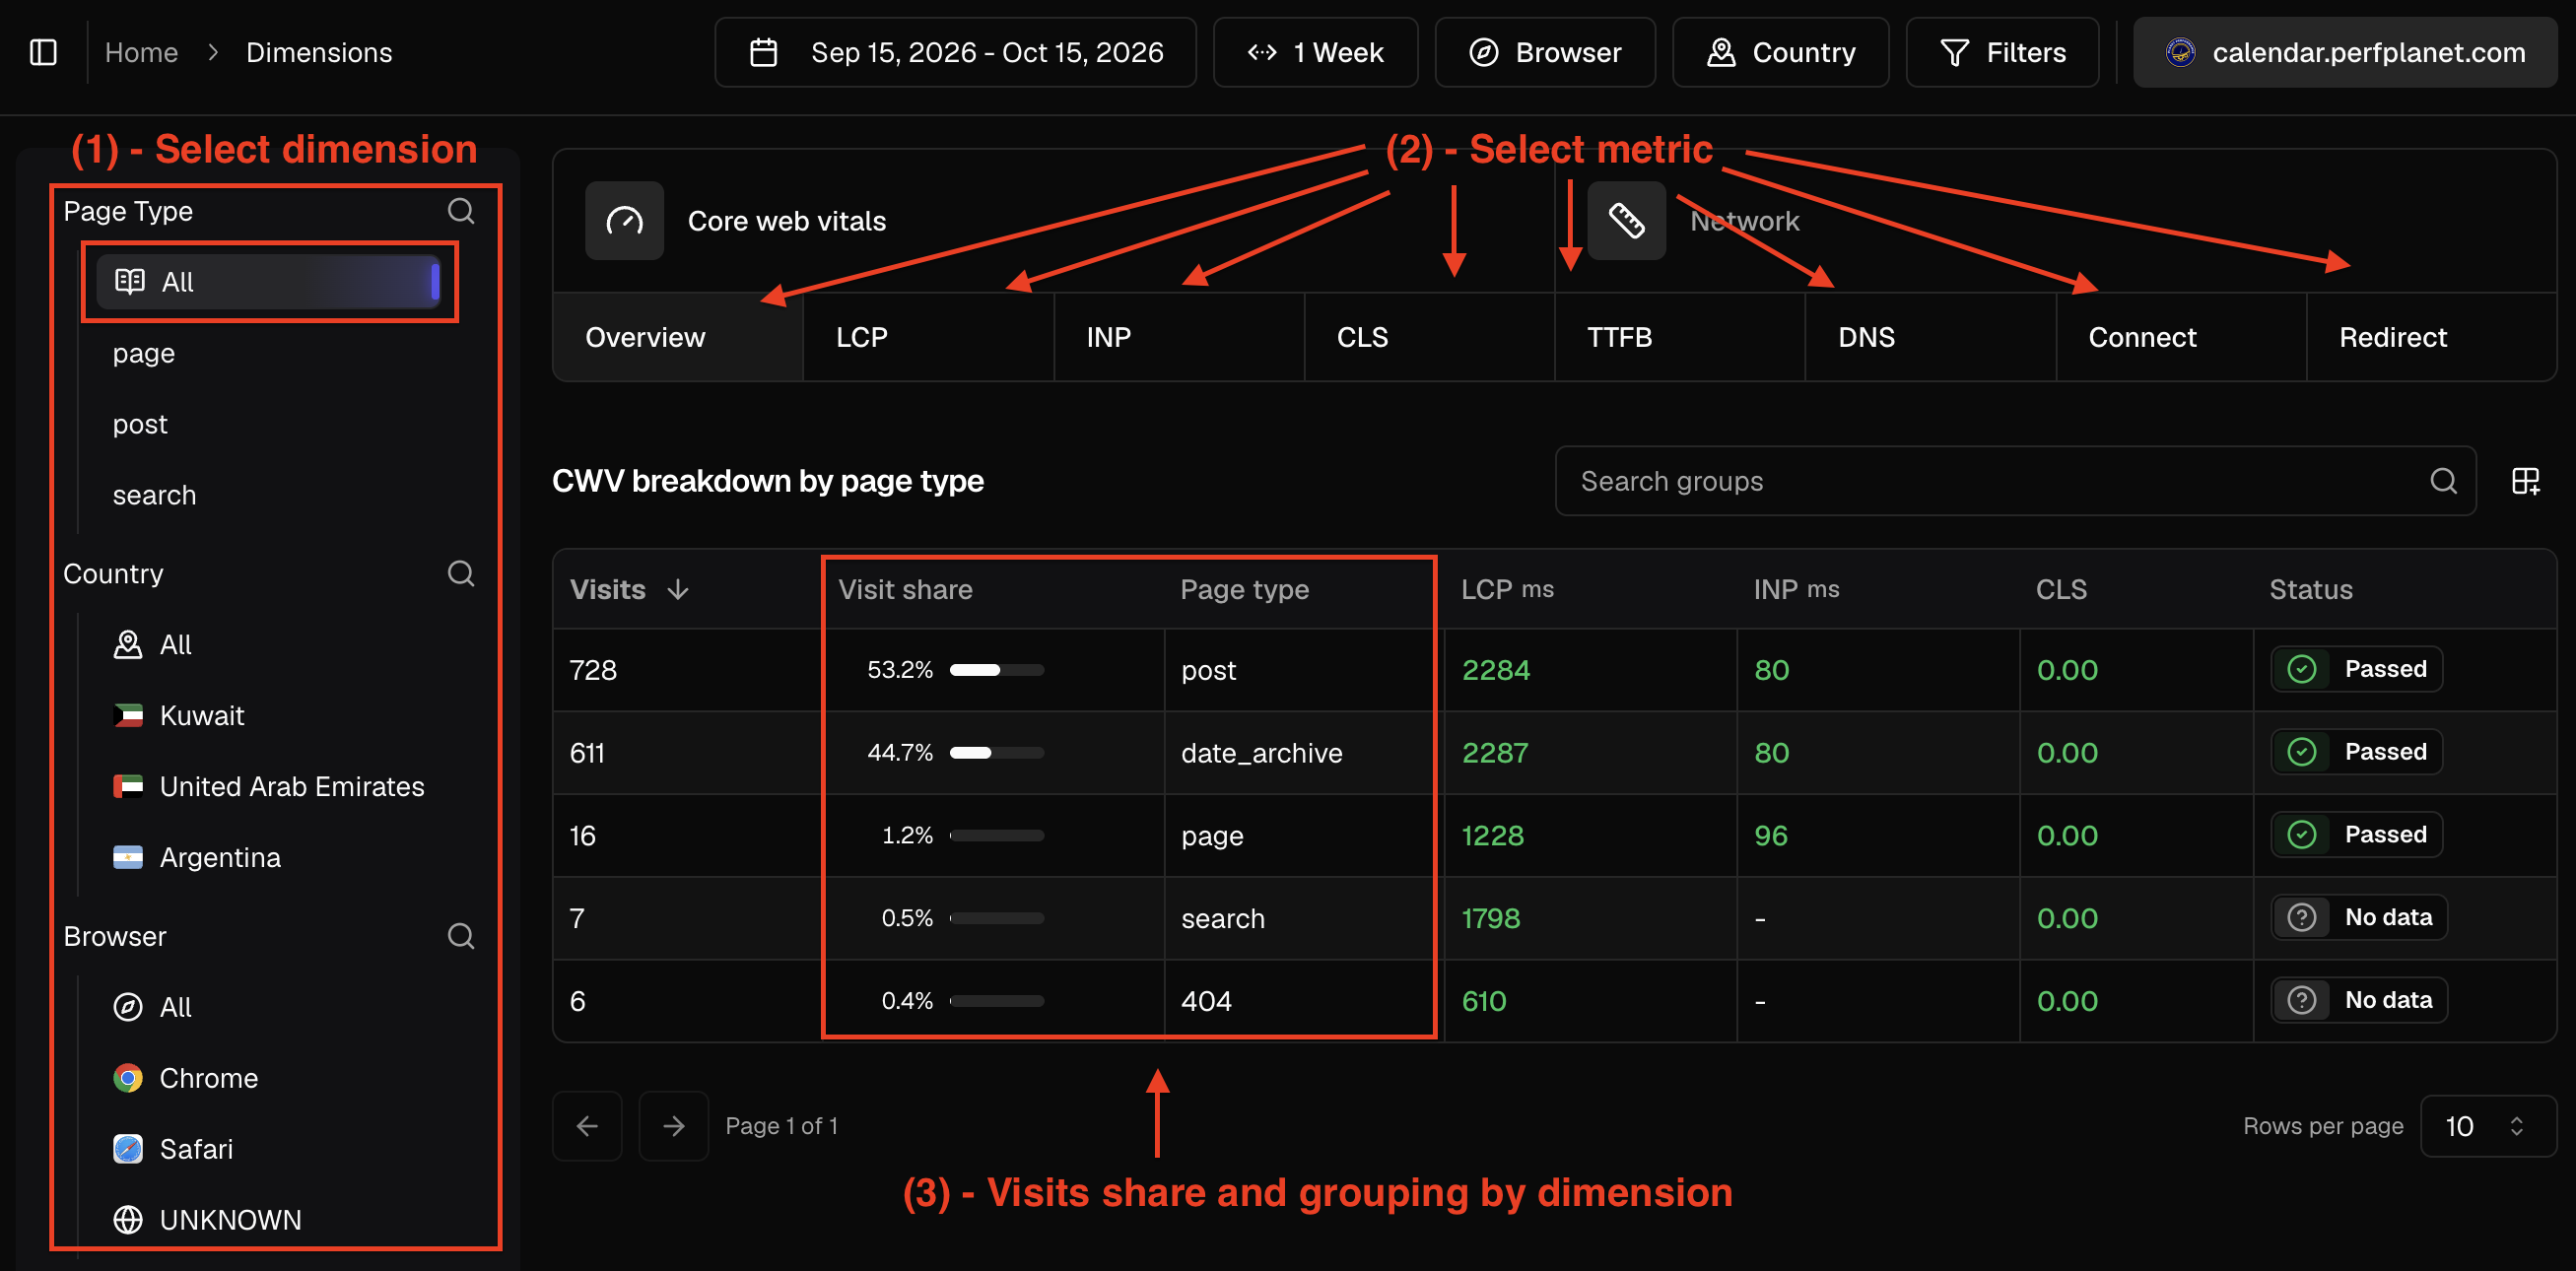
(1) - Select a dimension - In the example below, selecting “All” under Page Type shows a breakdown by page type.
(2) - Select a metric - We see the normal trend where the page type - “post” is the most popular and we see the Core Web Vitals metrics. We can also look in detail at the performance for LCP, INP, CLS, TTFB, DNS, Connect and Redirect.
(3) - Visit share and grouping by dimension - This is the real value that comes from the “Dimensions” feature. We notice an overall performance trend and later we can decide to drill down by filtering the data more - for example by Browser or Country. We can also notice outliers like the 404 pages.
Exploring the metric tabs reveals interesting trends in TTFB.
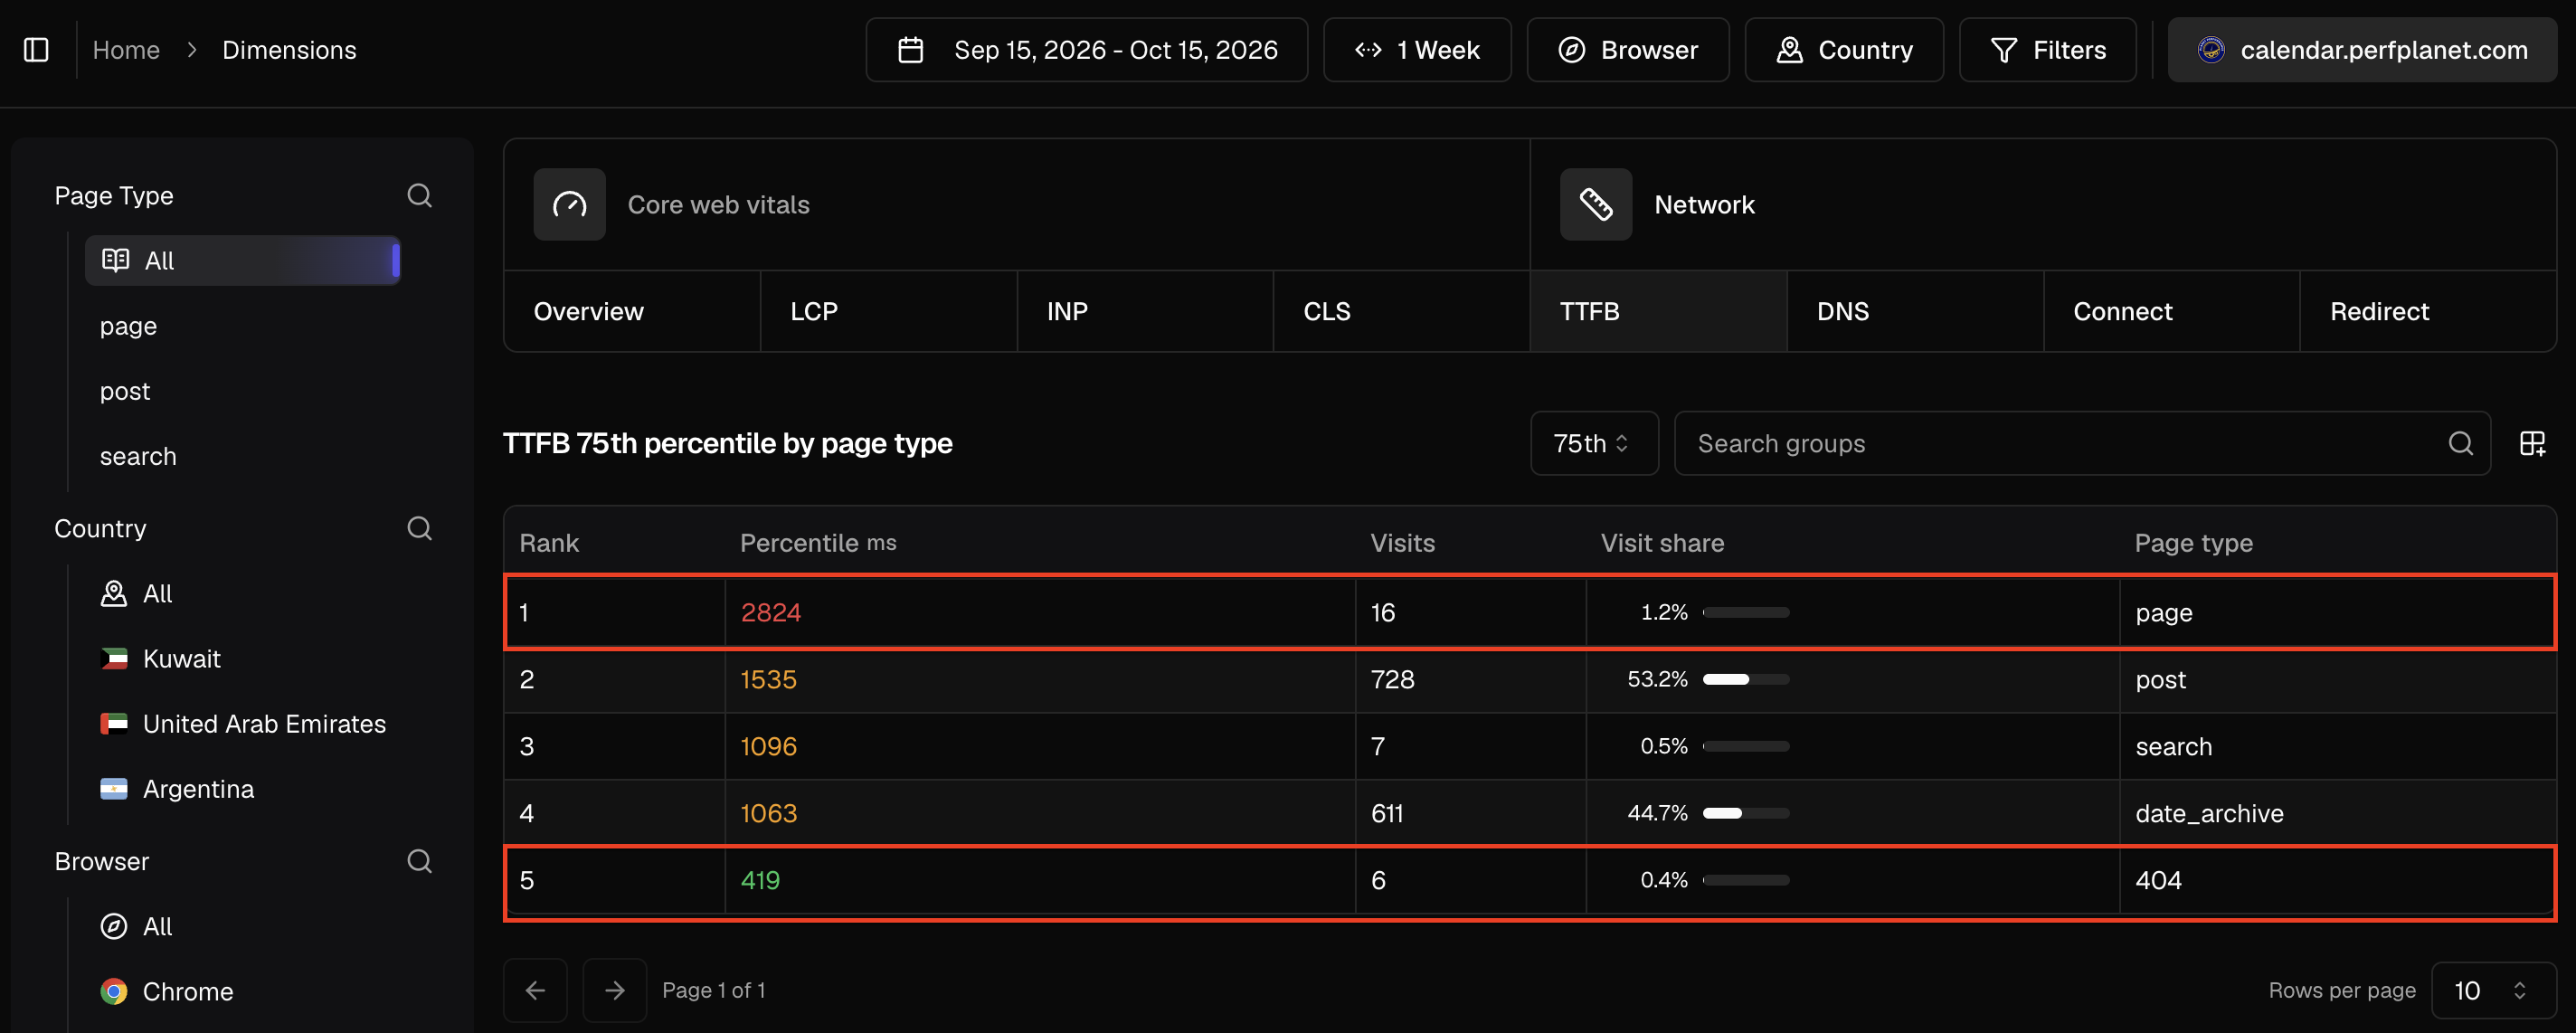
The “page” page type (yes, WordPress has a page type called “page”) has slow TTFB but accounts for only 1.2% of visits. As webmasters, we can decide whether to focus on optimizing these pages. Improving TTFB for the “post” page type may have a greater impact because it accounts for 53.2% of visits.
We also notice the usual trend for 404 pages. They are usually fast pages. In our case, we are lucky because only 0.4% of visits are to 404 pages. A 404 page means that the user landed on a page whose content moved or the user followed a broken link. 404 pages provide a poor user experience. They are typically fast and can skew our performance data when they account for a large share of visits. If 30% of visits were to 404 pages, the website’s TTFB would look better, but that would create a misleading impression.
Dimensions can be valuable when we understand our business, stay curious about the data, and keep asking, “What should we investigate next?”
A few ideas for understanding the experience
Dimensions: who are you looking at?
A dimension groups visits by something they share. Choose Country, Browser, Device Type, or Page Type to see how experiences differ across your audience.
Breakdowns: how does each group perform?
A breakdown compares those groups side by side. See where TTFB, INP, and CLS are good or need attention. Select a group to explore its pages.
Distributions: how much traffic does each group represent?
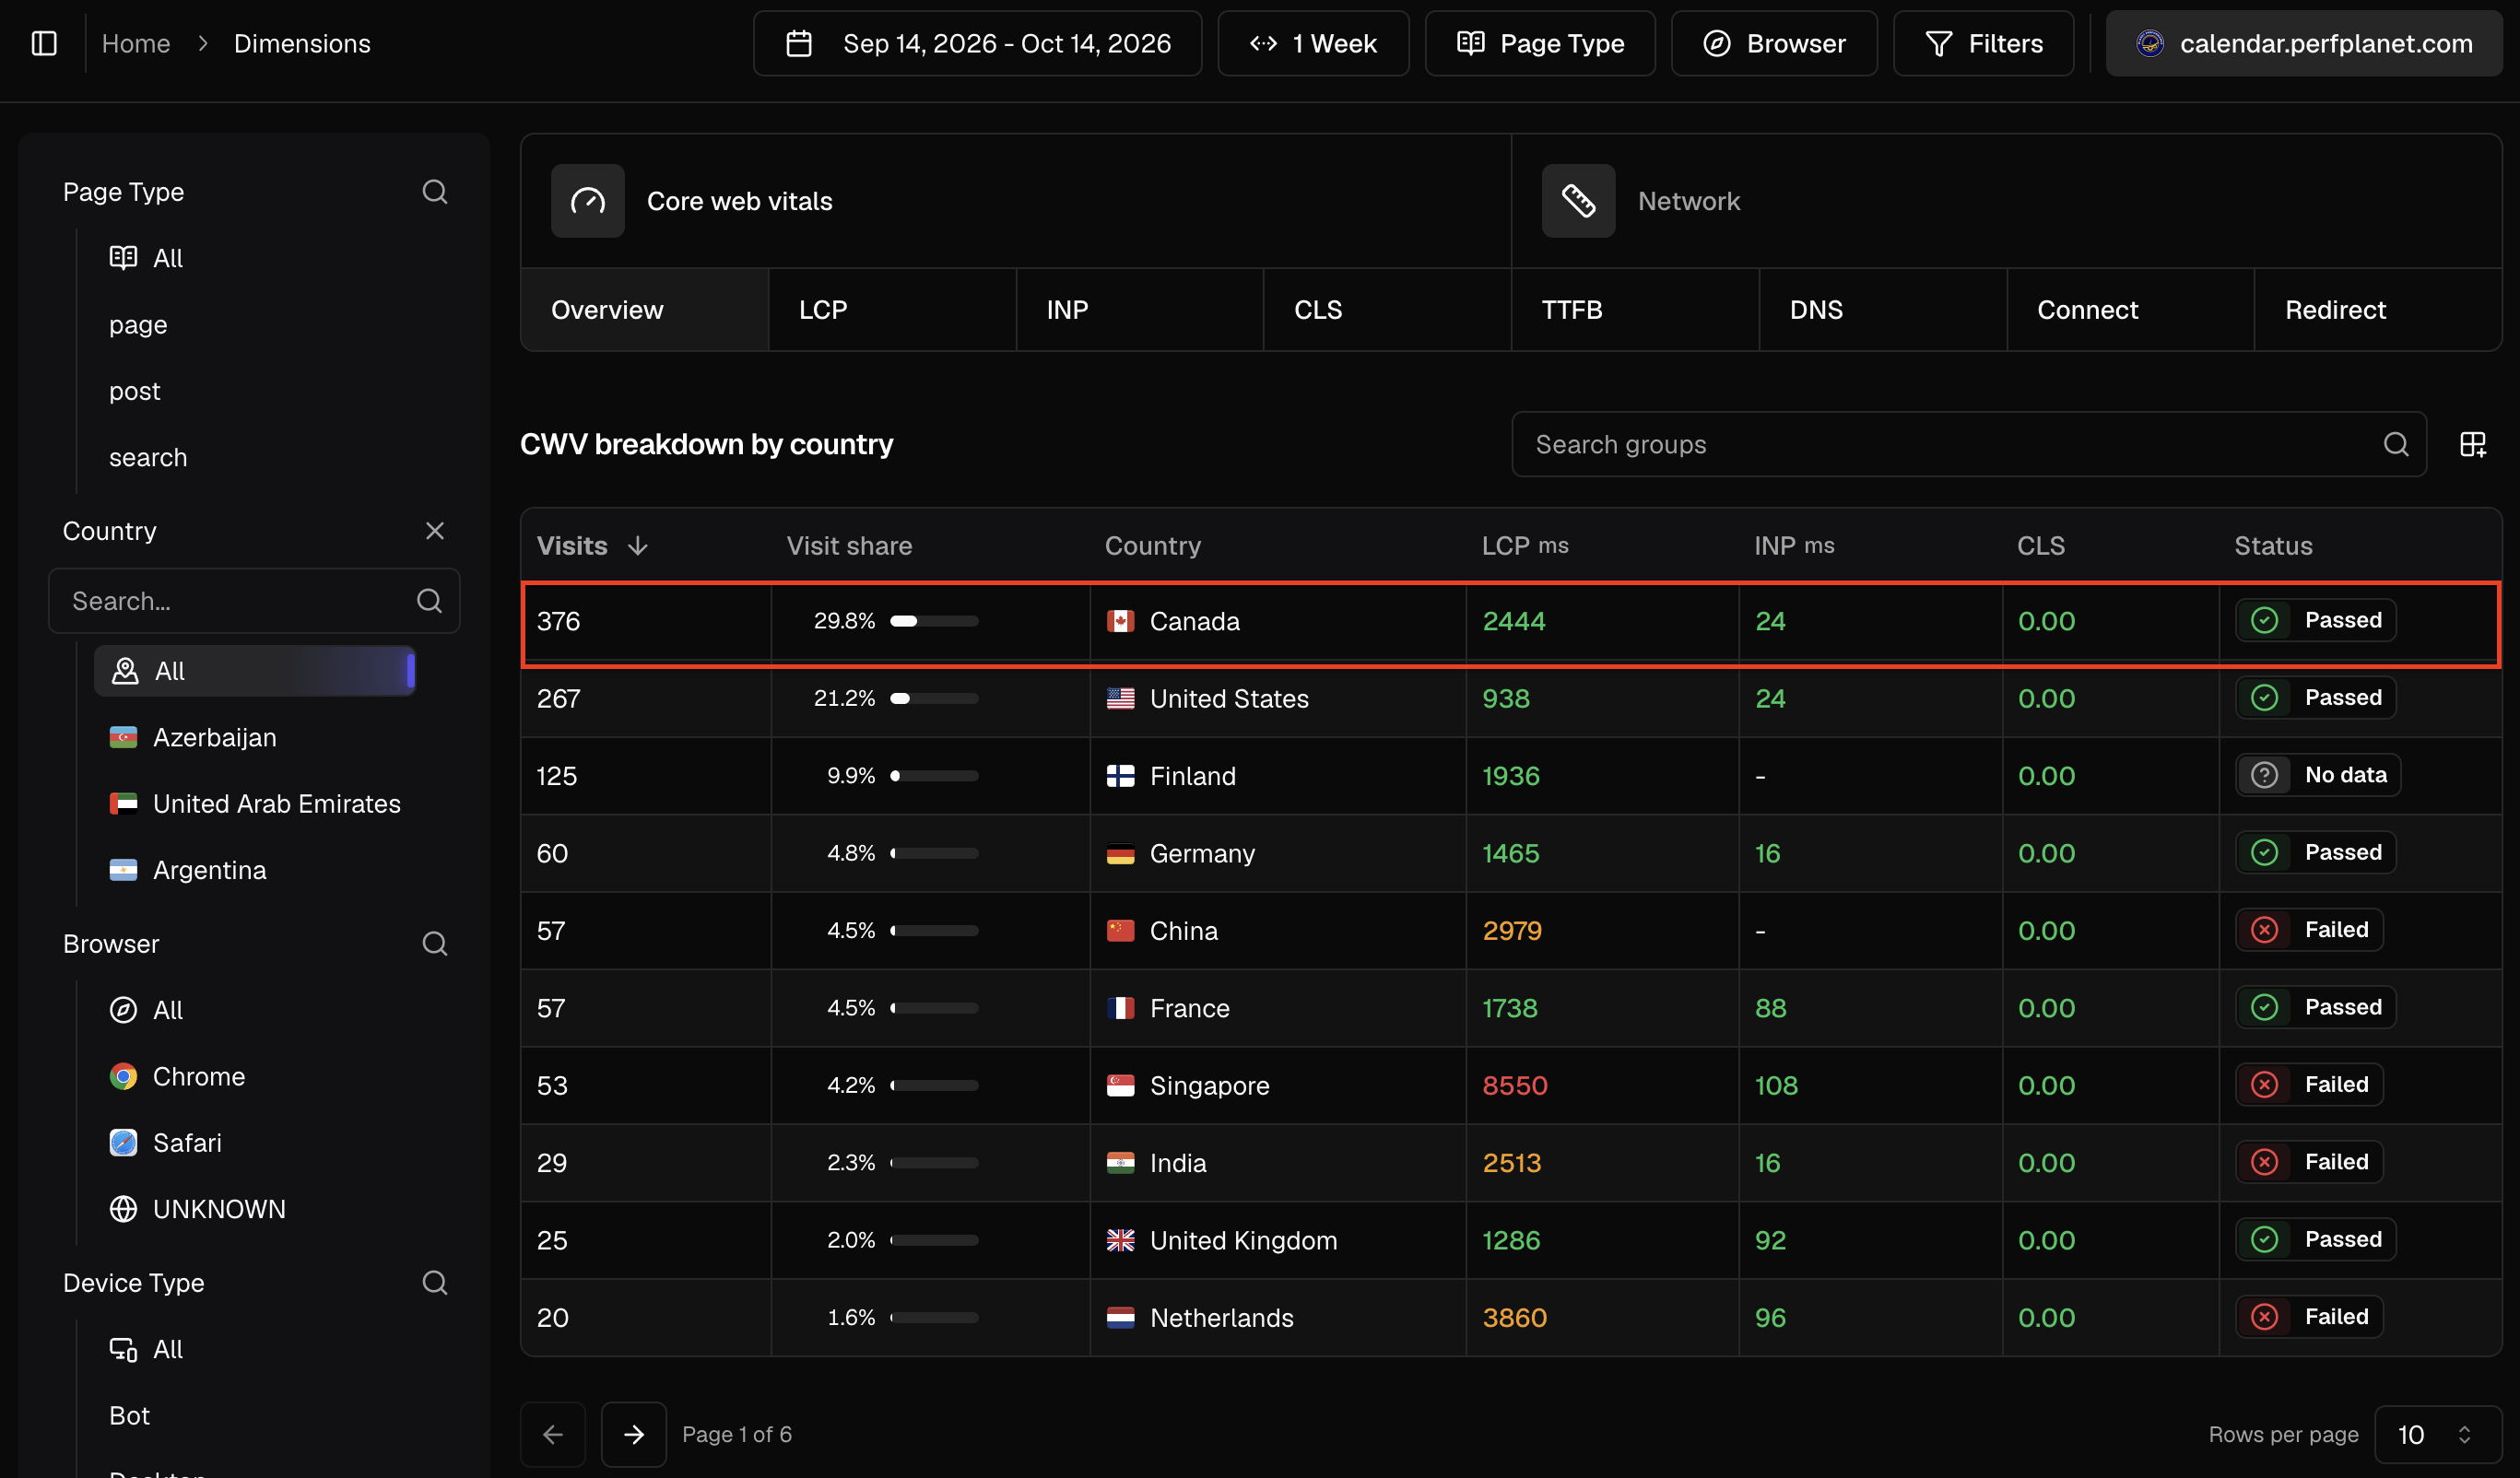
The distribution bars show each group's share of visits within your dates and filters. Canada's 29.8% is its share of traffic; the performance measurements beside it show how that audience experienced the site.
How far you can drill down today
You can combine filters and explore a group's pages, but compare one dimension at a time. Moving from a Country to Device Type and then Browser requires changing filters and views manually. Custom dimensions are not yet available in this view.
Check visit counts as you narrow your audience: the tables do not currently flag small samples. A wider date range can help you see whether a pattern holds.
—
Two real examples
The country comparisons and Canada example cover 14 September to 14 October 2026. The page-type walkthrough and Singapore page breakdowns cover 15 September to 15 October 2026.
Thank you to Stoyan Stefanov for allowing us to use data from calendar.perfplanet.com in this article.
Singapore: a long wait for the first response
The country breakdown shows a difference: 8.55 seconds for Singapore compared to 0.94 seconds for the USA. Both figures use the 75th percentile. Singapore accounts for 53 visits, or 4.2% of traffic.
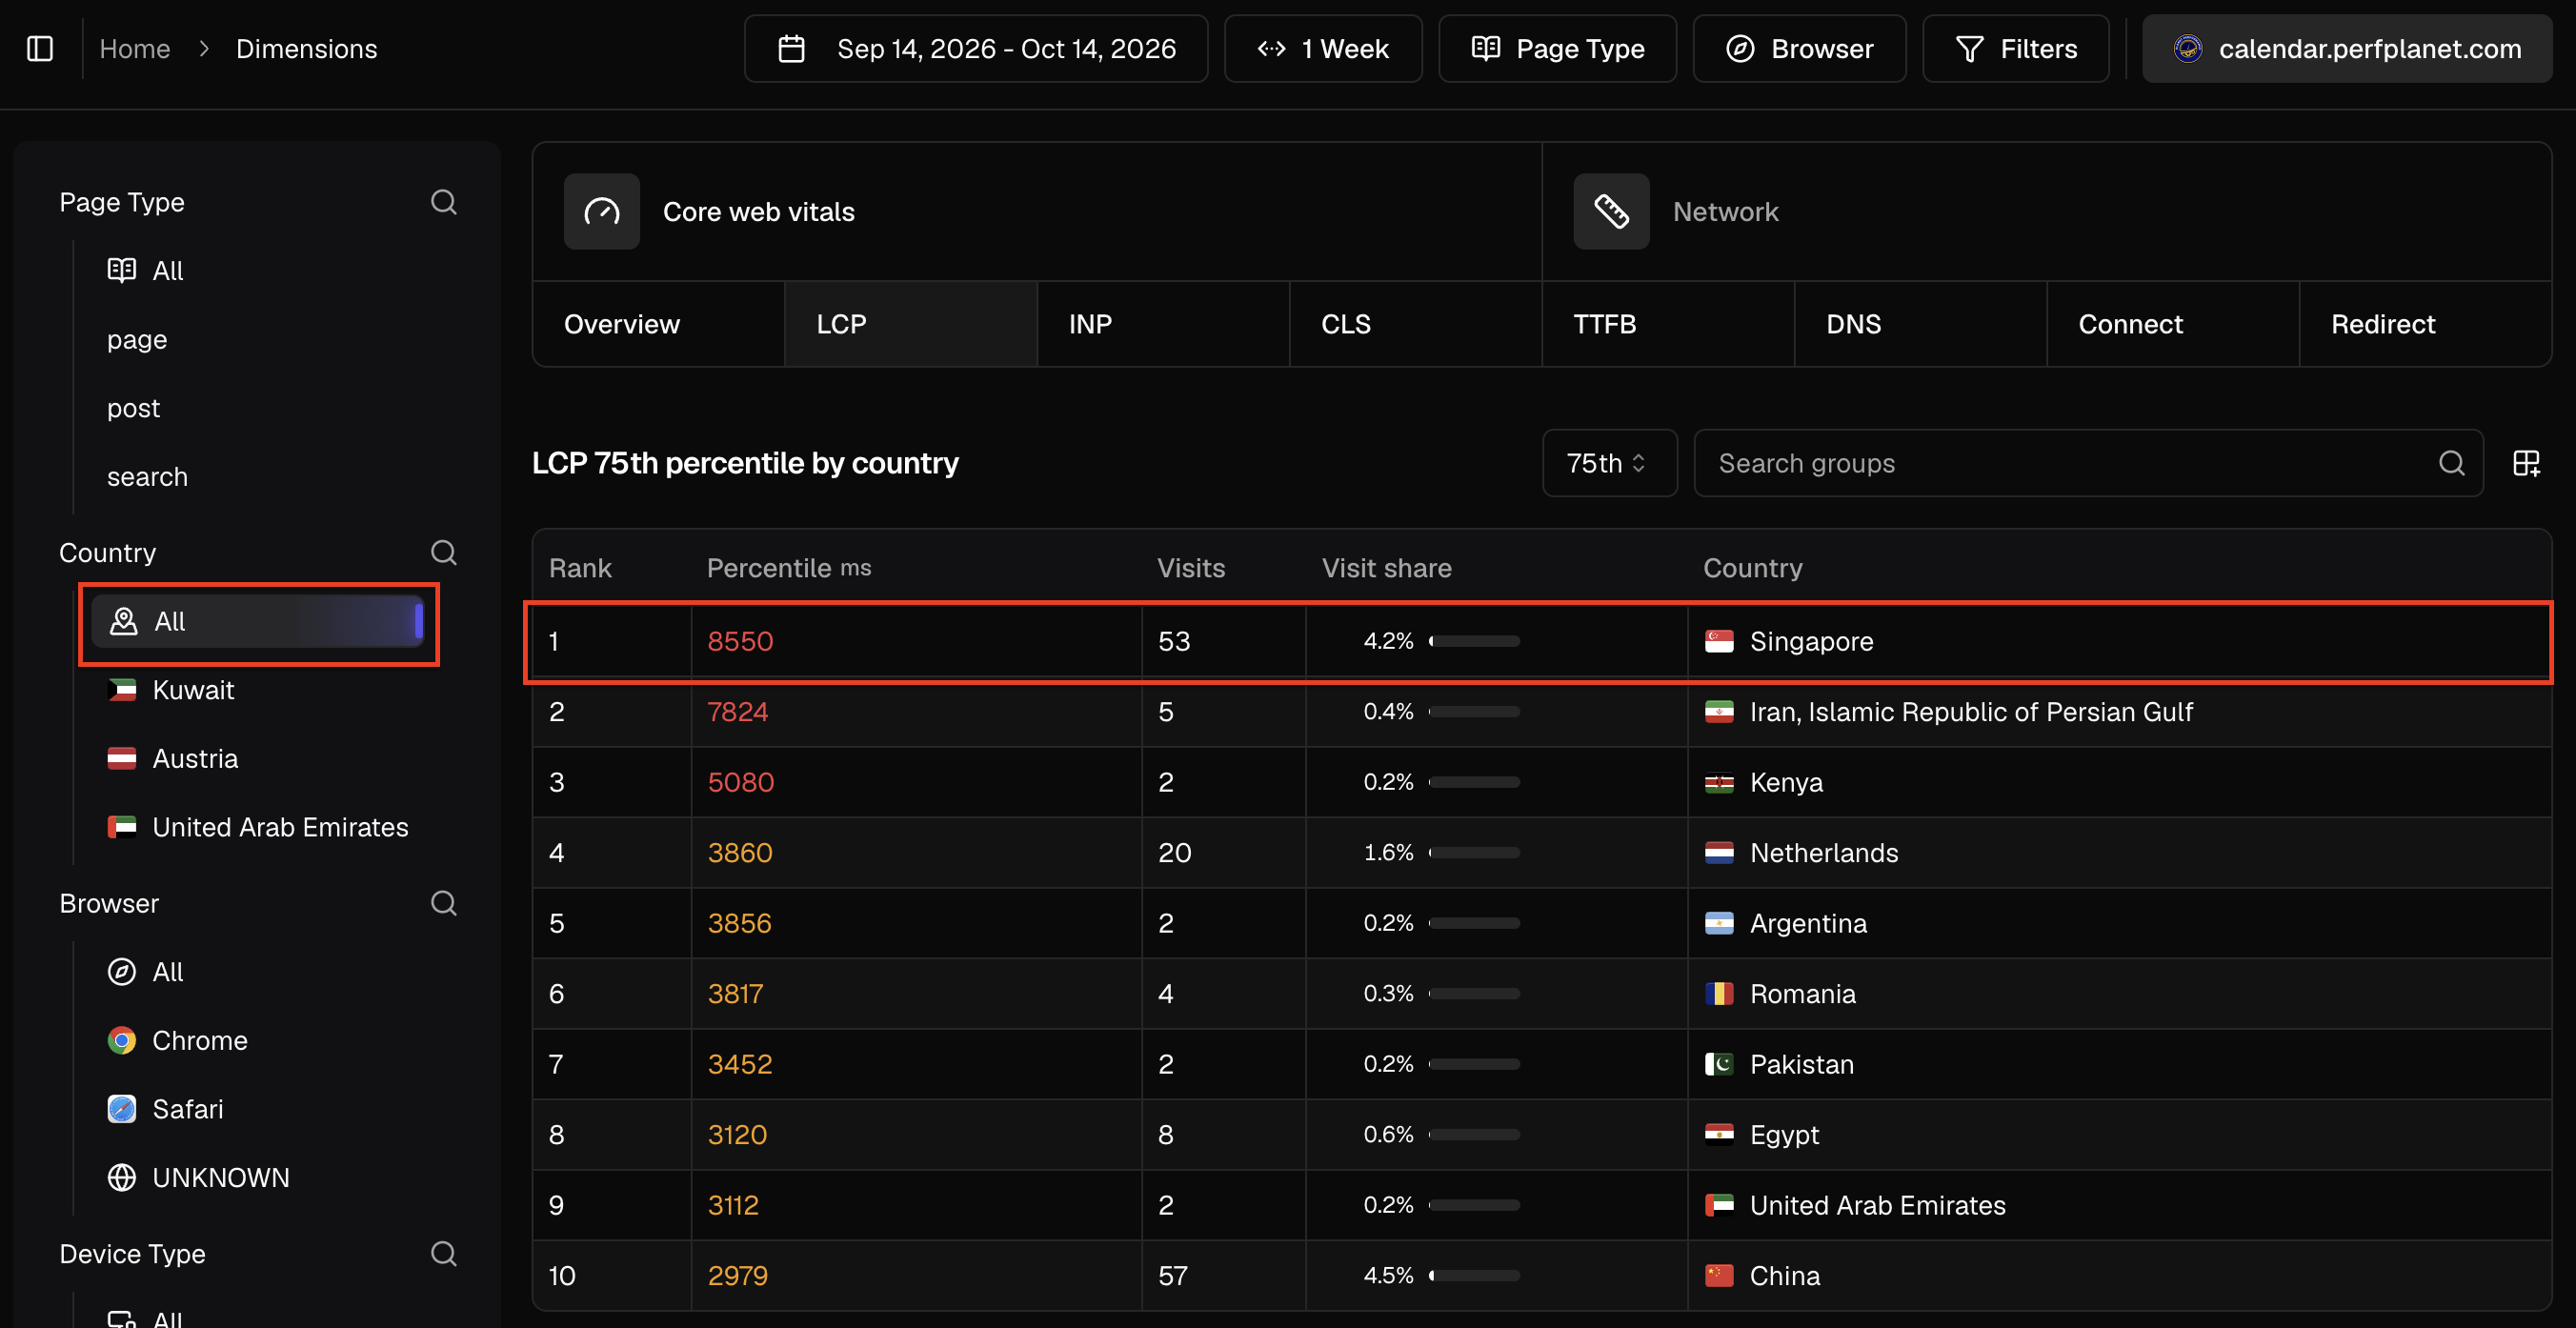
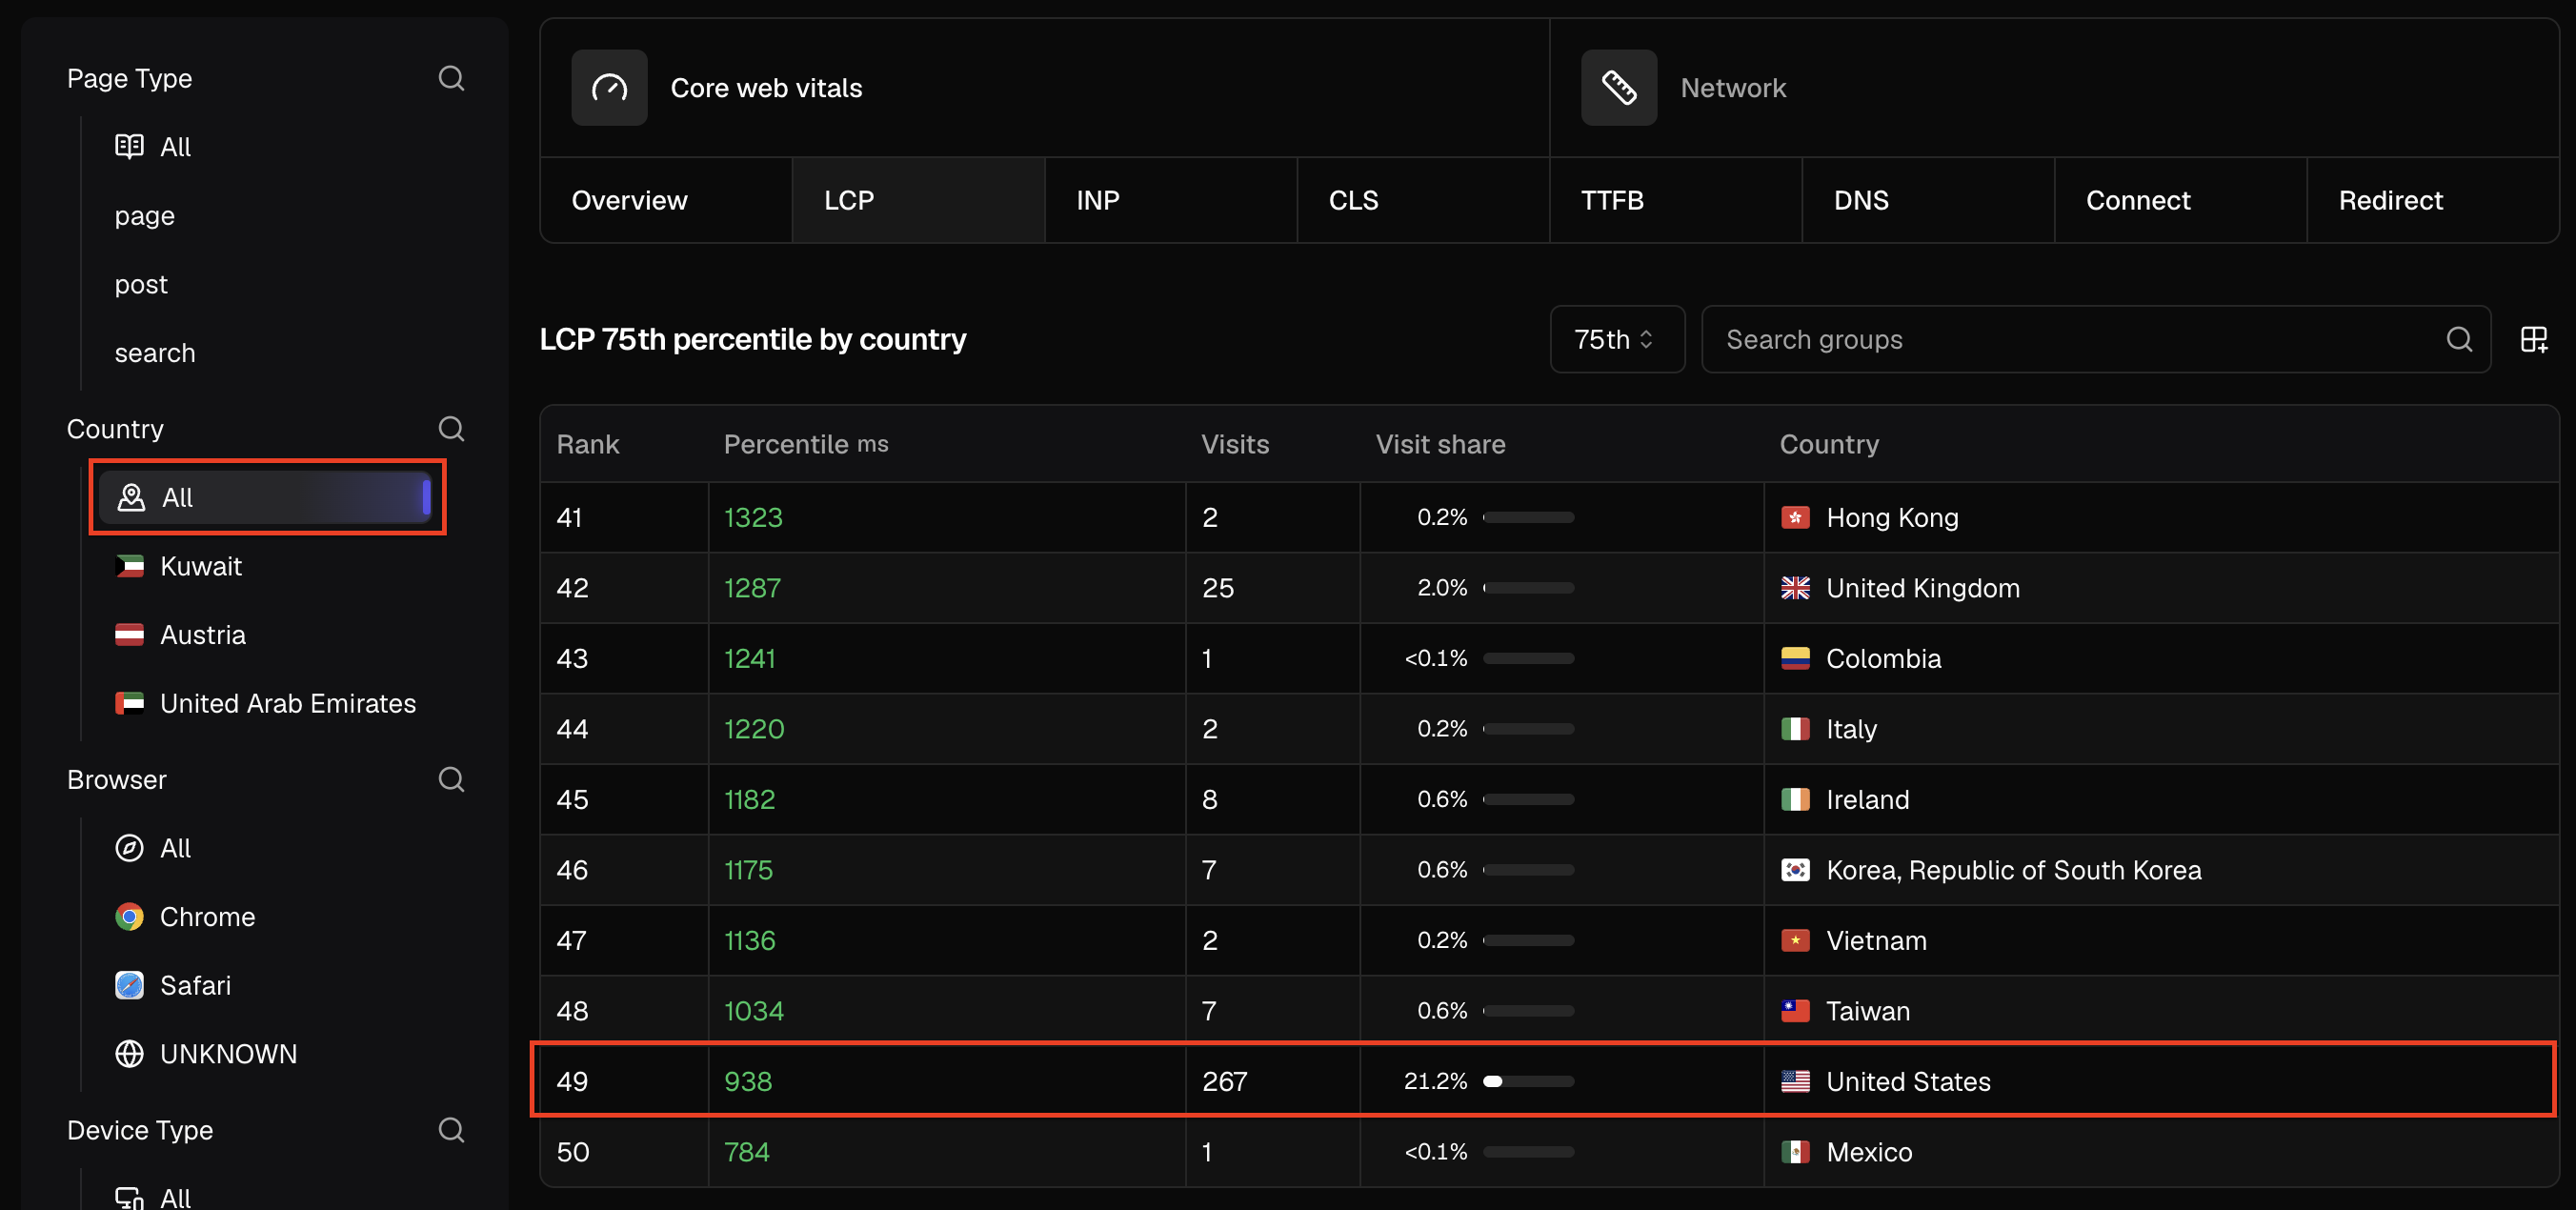
Opening Singapore's pages revealed high TTFB. One visit waited 20.77 seconds for that response, with an LCP of 20.87 seconds. That gives us a good idea of where to start: investigate server, cache, and network delays. Consider using a CDN.
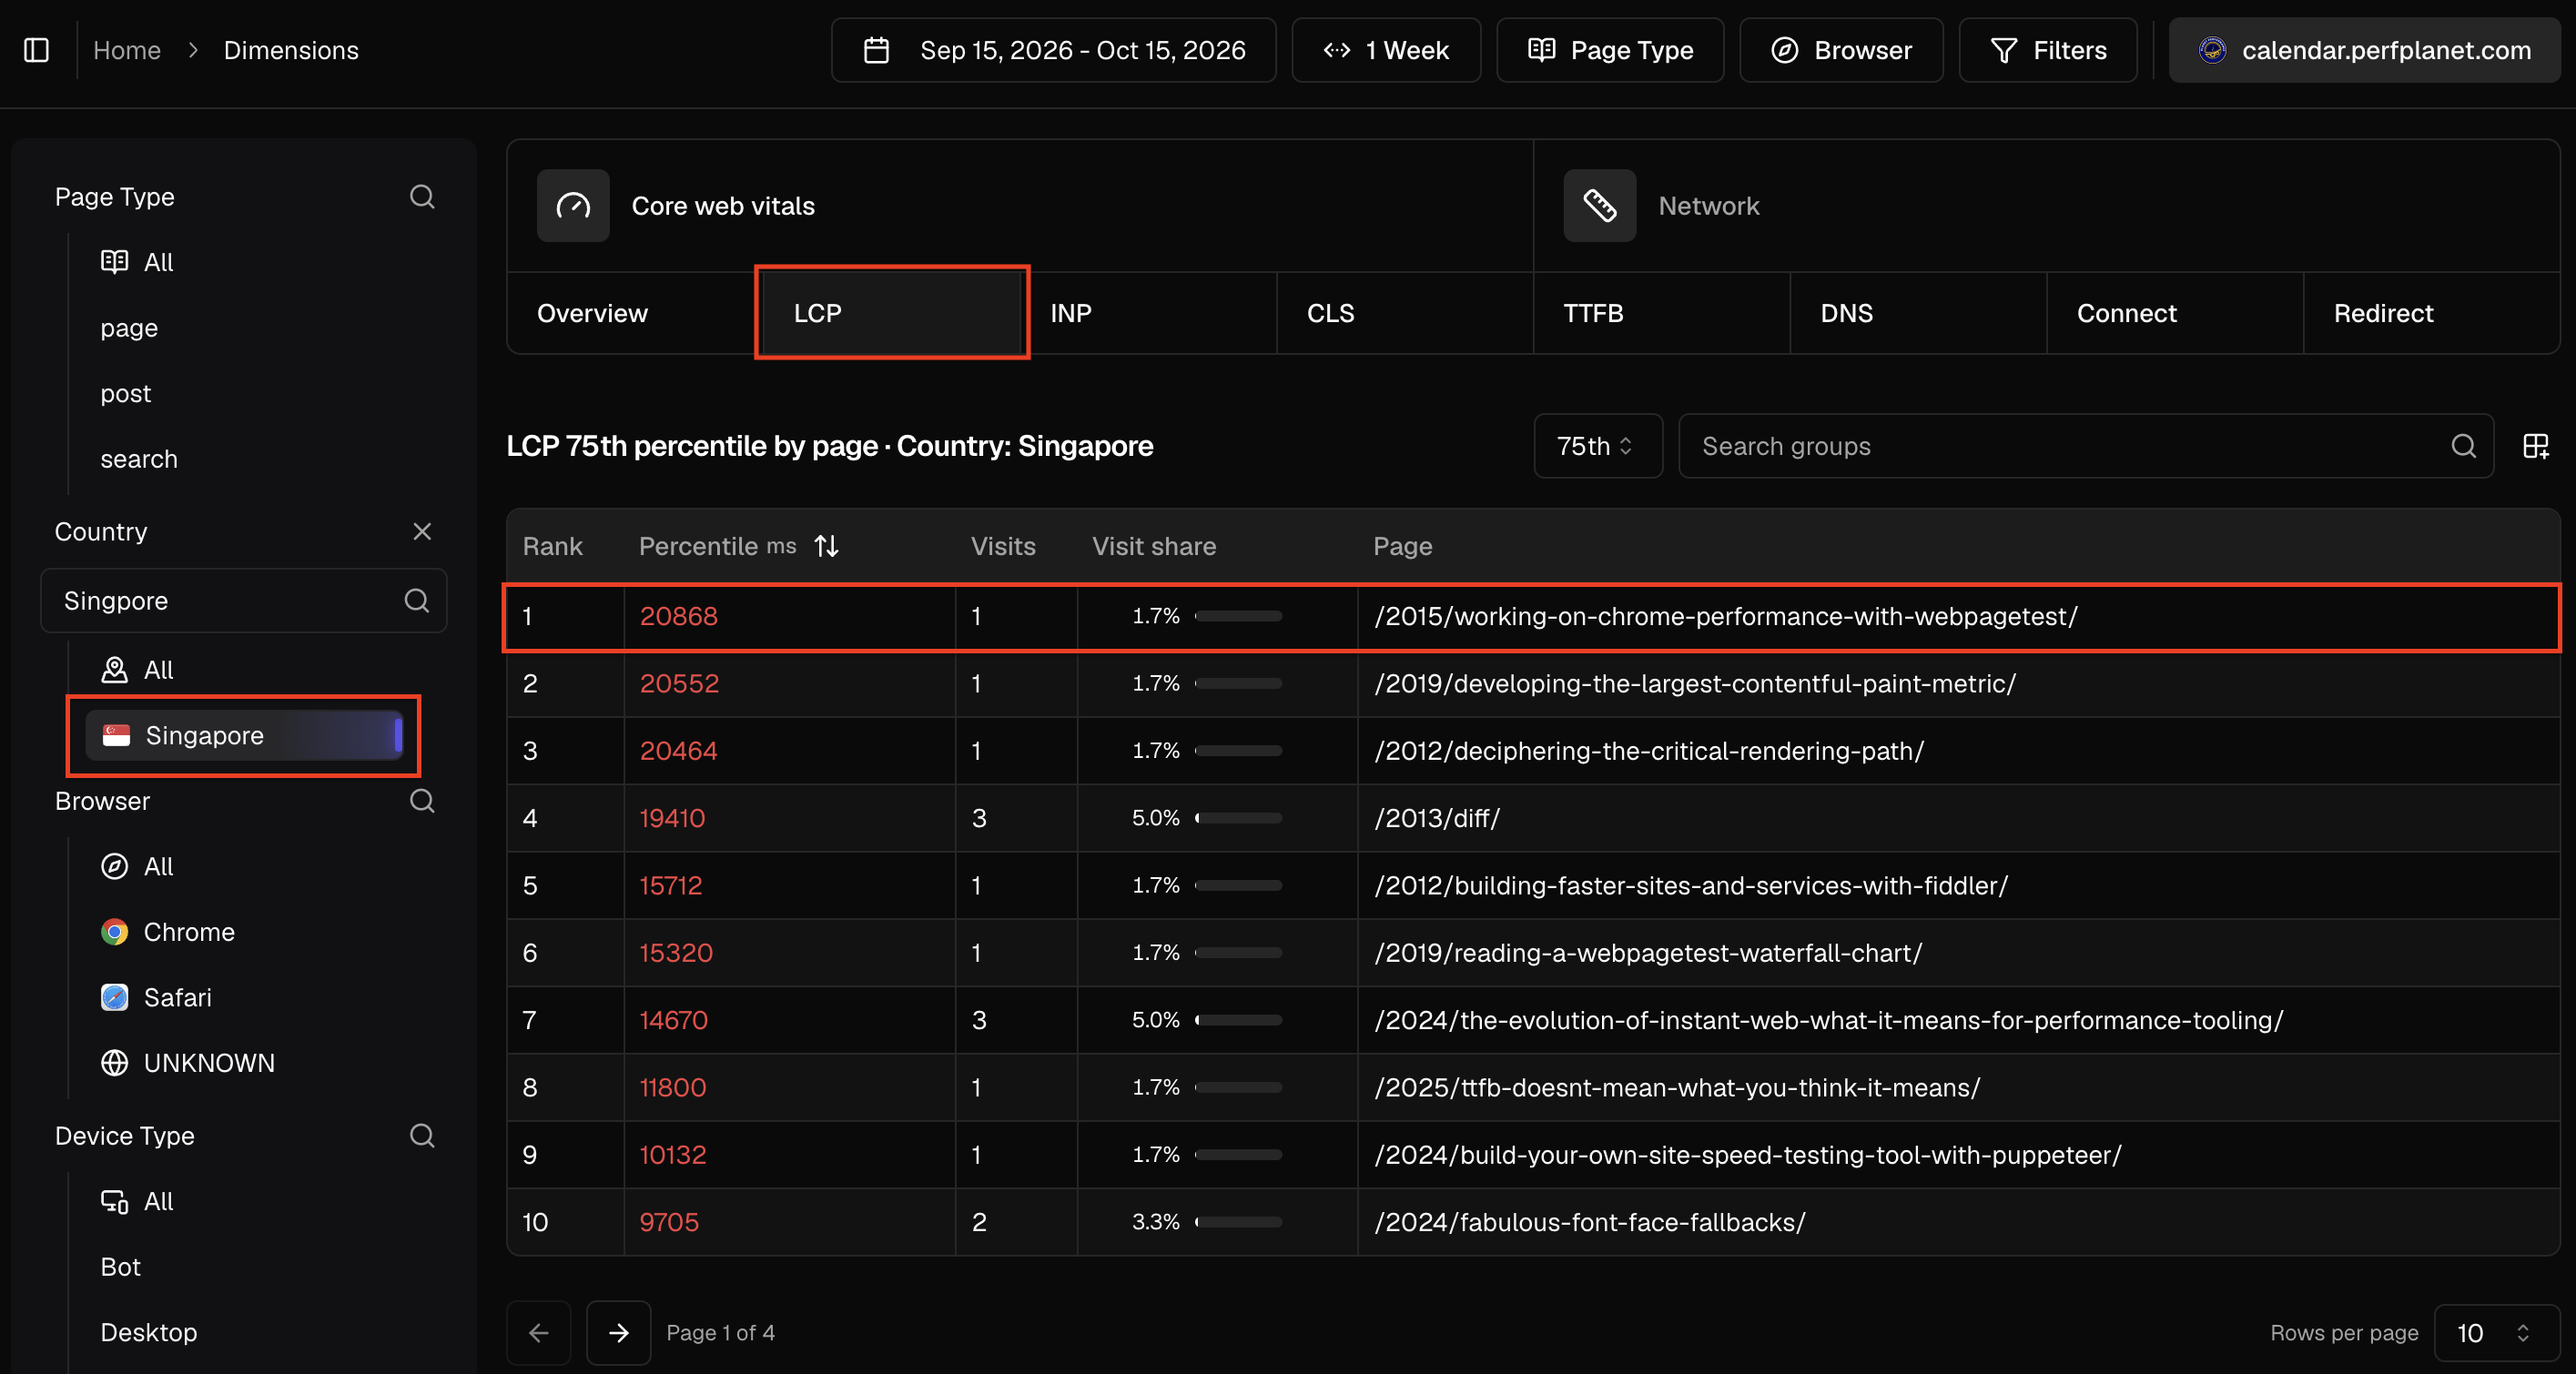
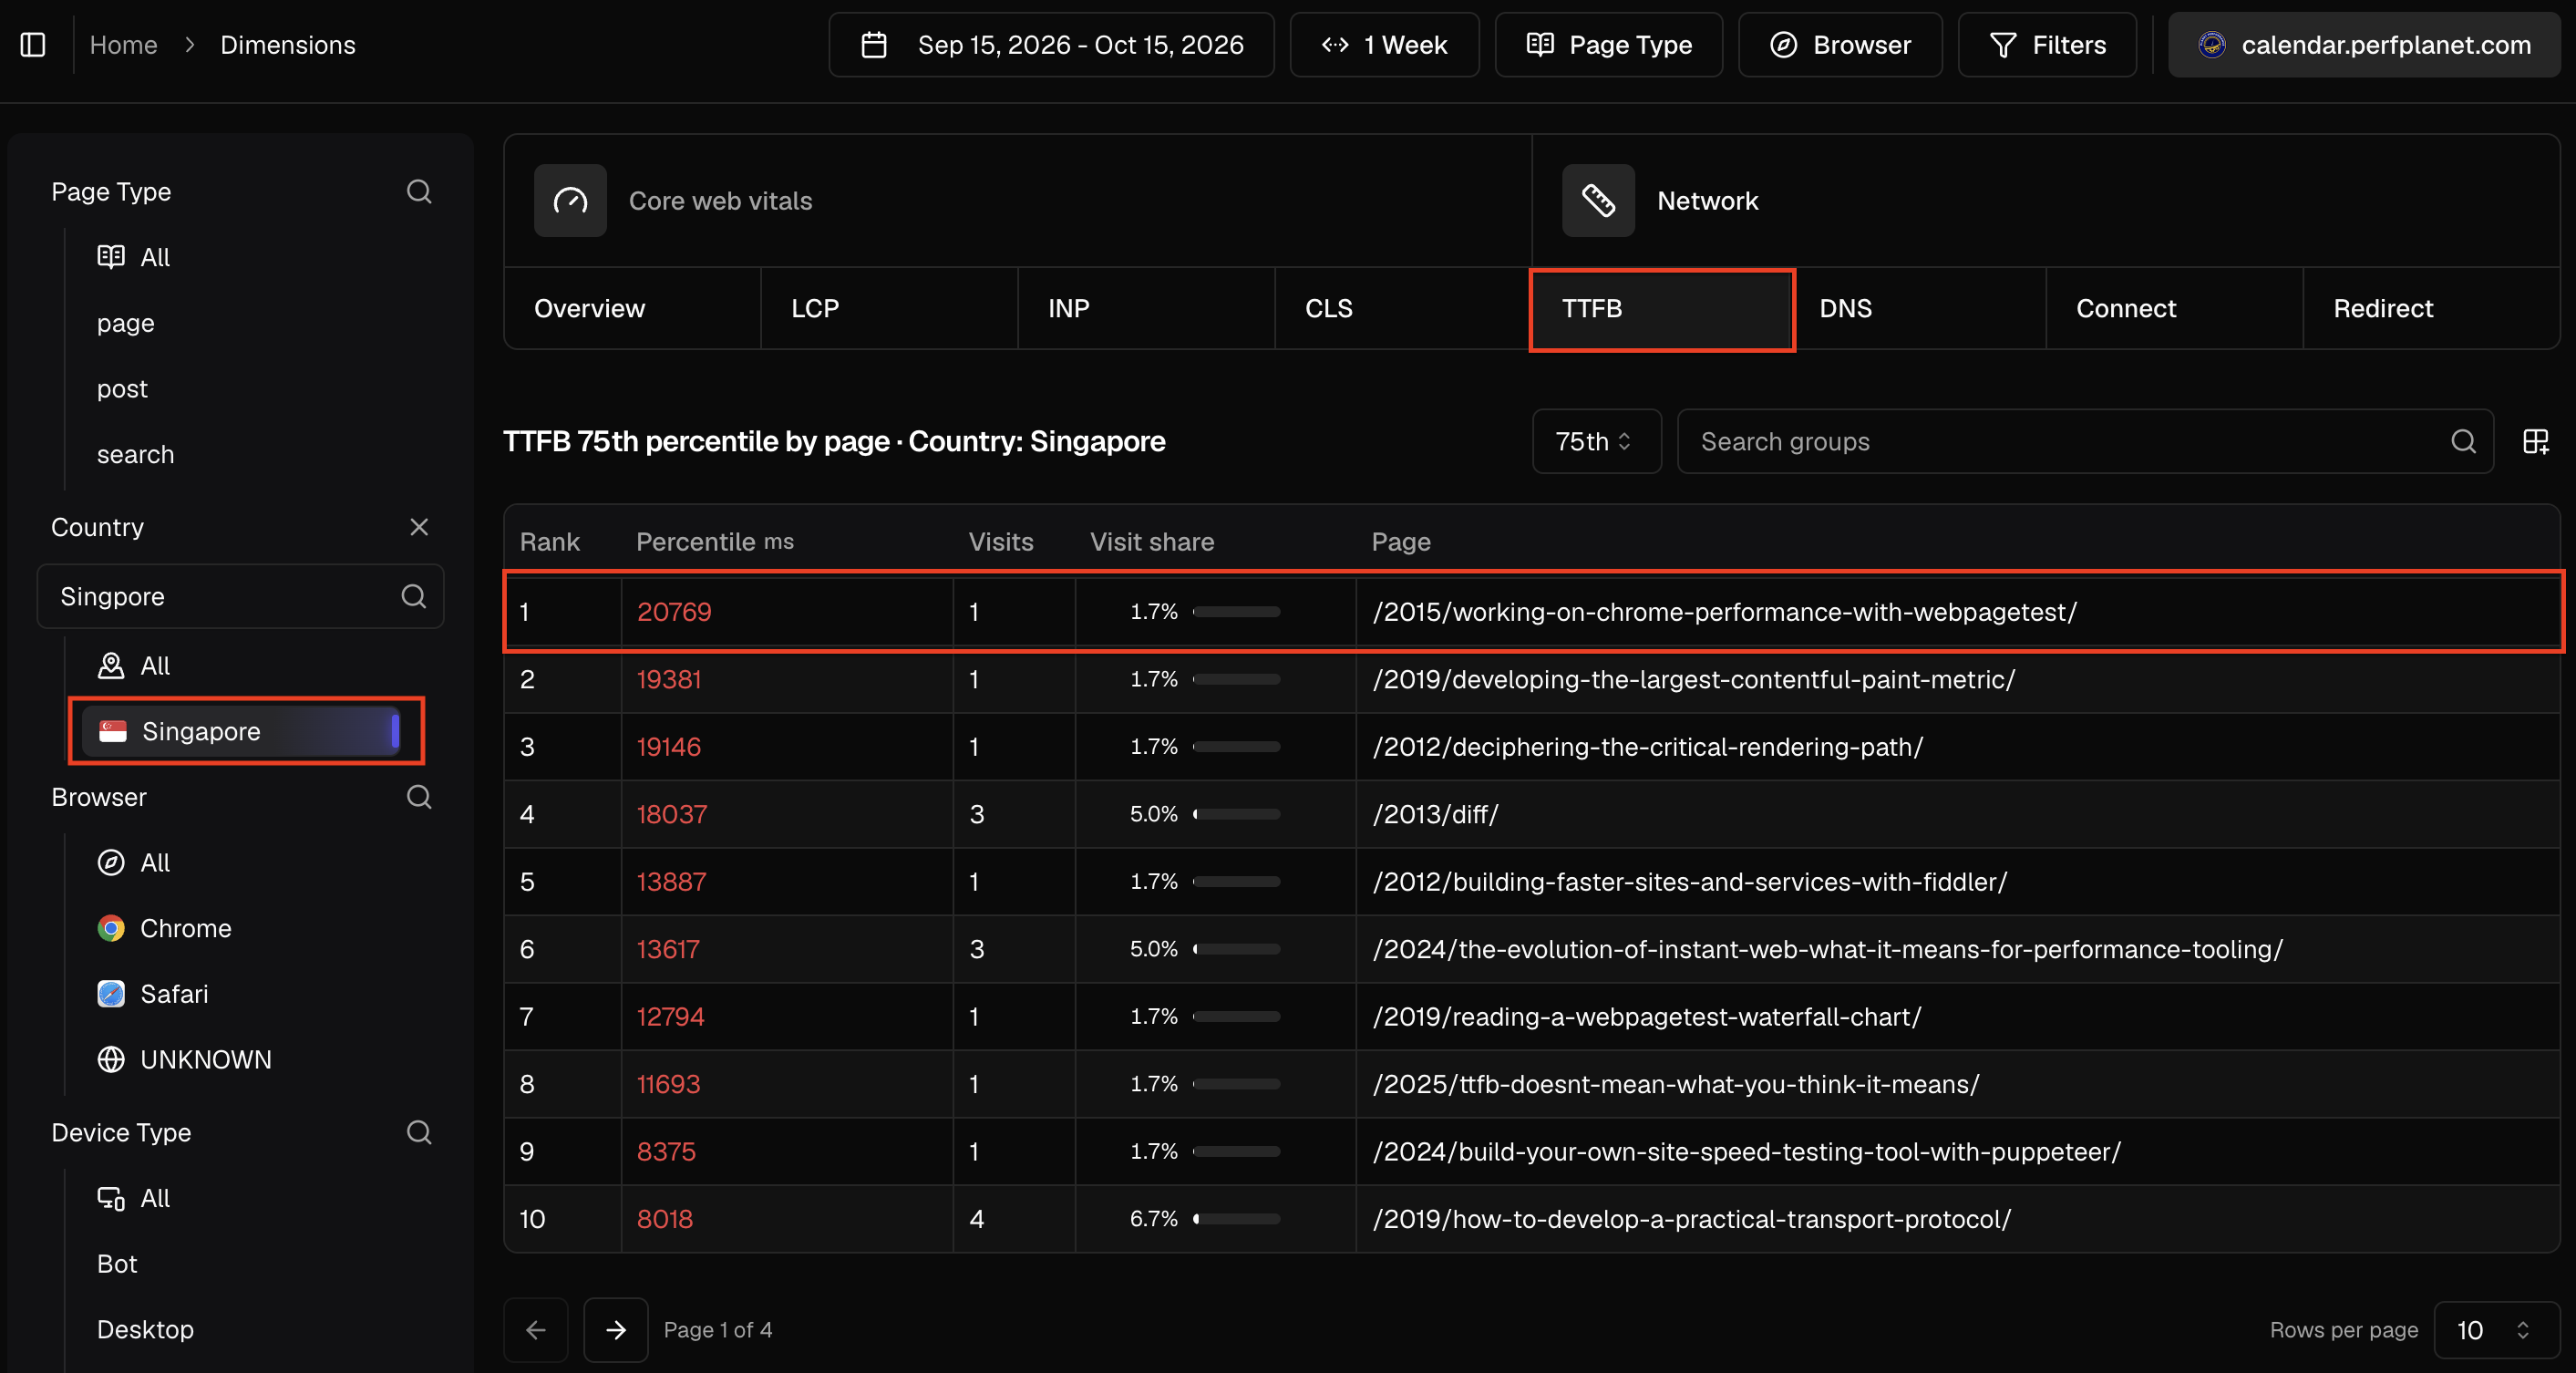
The cause of the high TTFB is still unconfirmed, and these pages have few visits each, so we would check whether the pattern holds across more visits and locations.
Canada: one busy page worth improving
Canada accounts for 29.8% of all visits. Of its 376 visits, 360 went to the /2025/ archive. That page's 75th-percentile LCP is 2.51 seconds, just a bit above the good-performance threshold of 2.5 seconds.
This is a smaller delay on a much busier page. Improving it could benefit a larger audience, not just the visitors from Canada. Page details identified a paragraph of text behind the slower loading measurement, giving us a specific piece of content to investigate next.
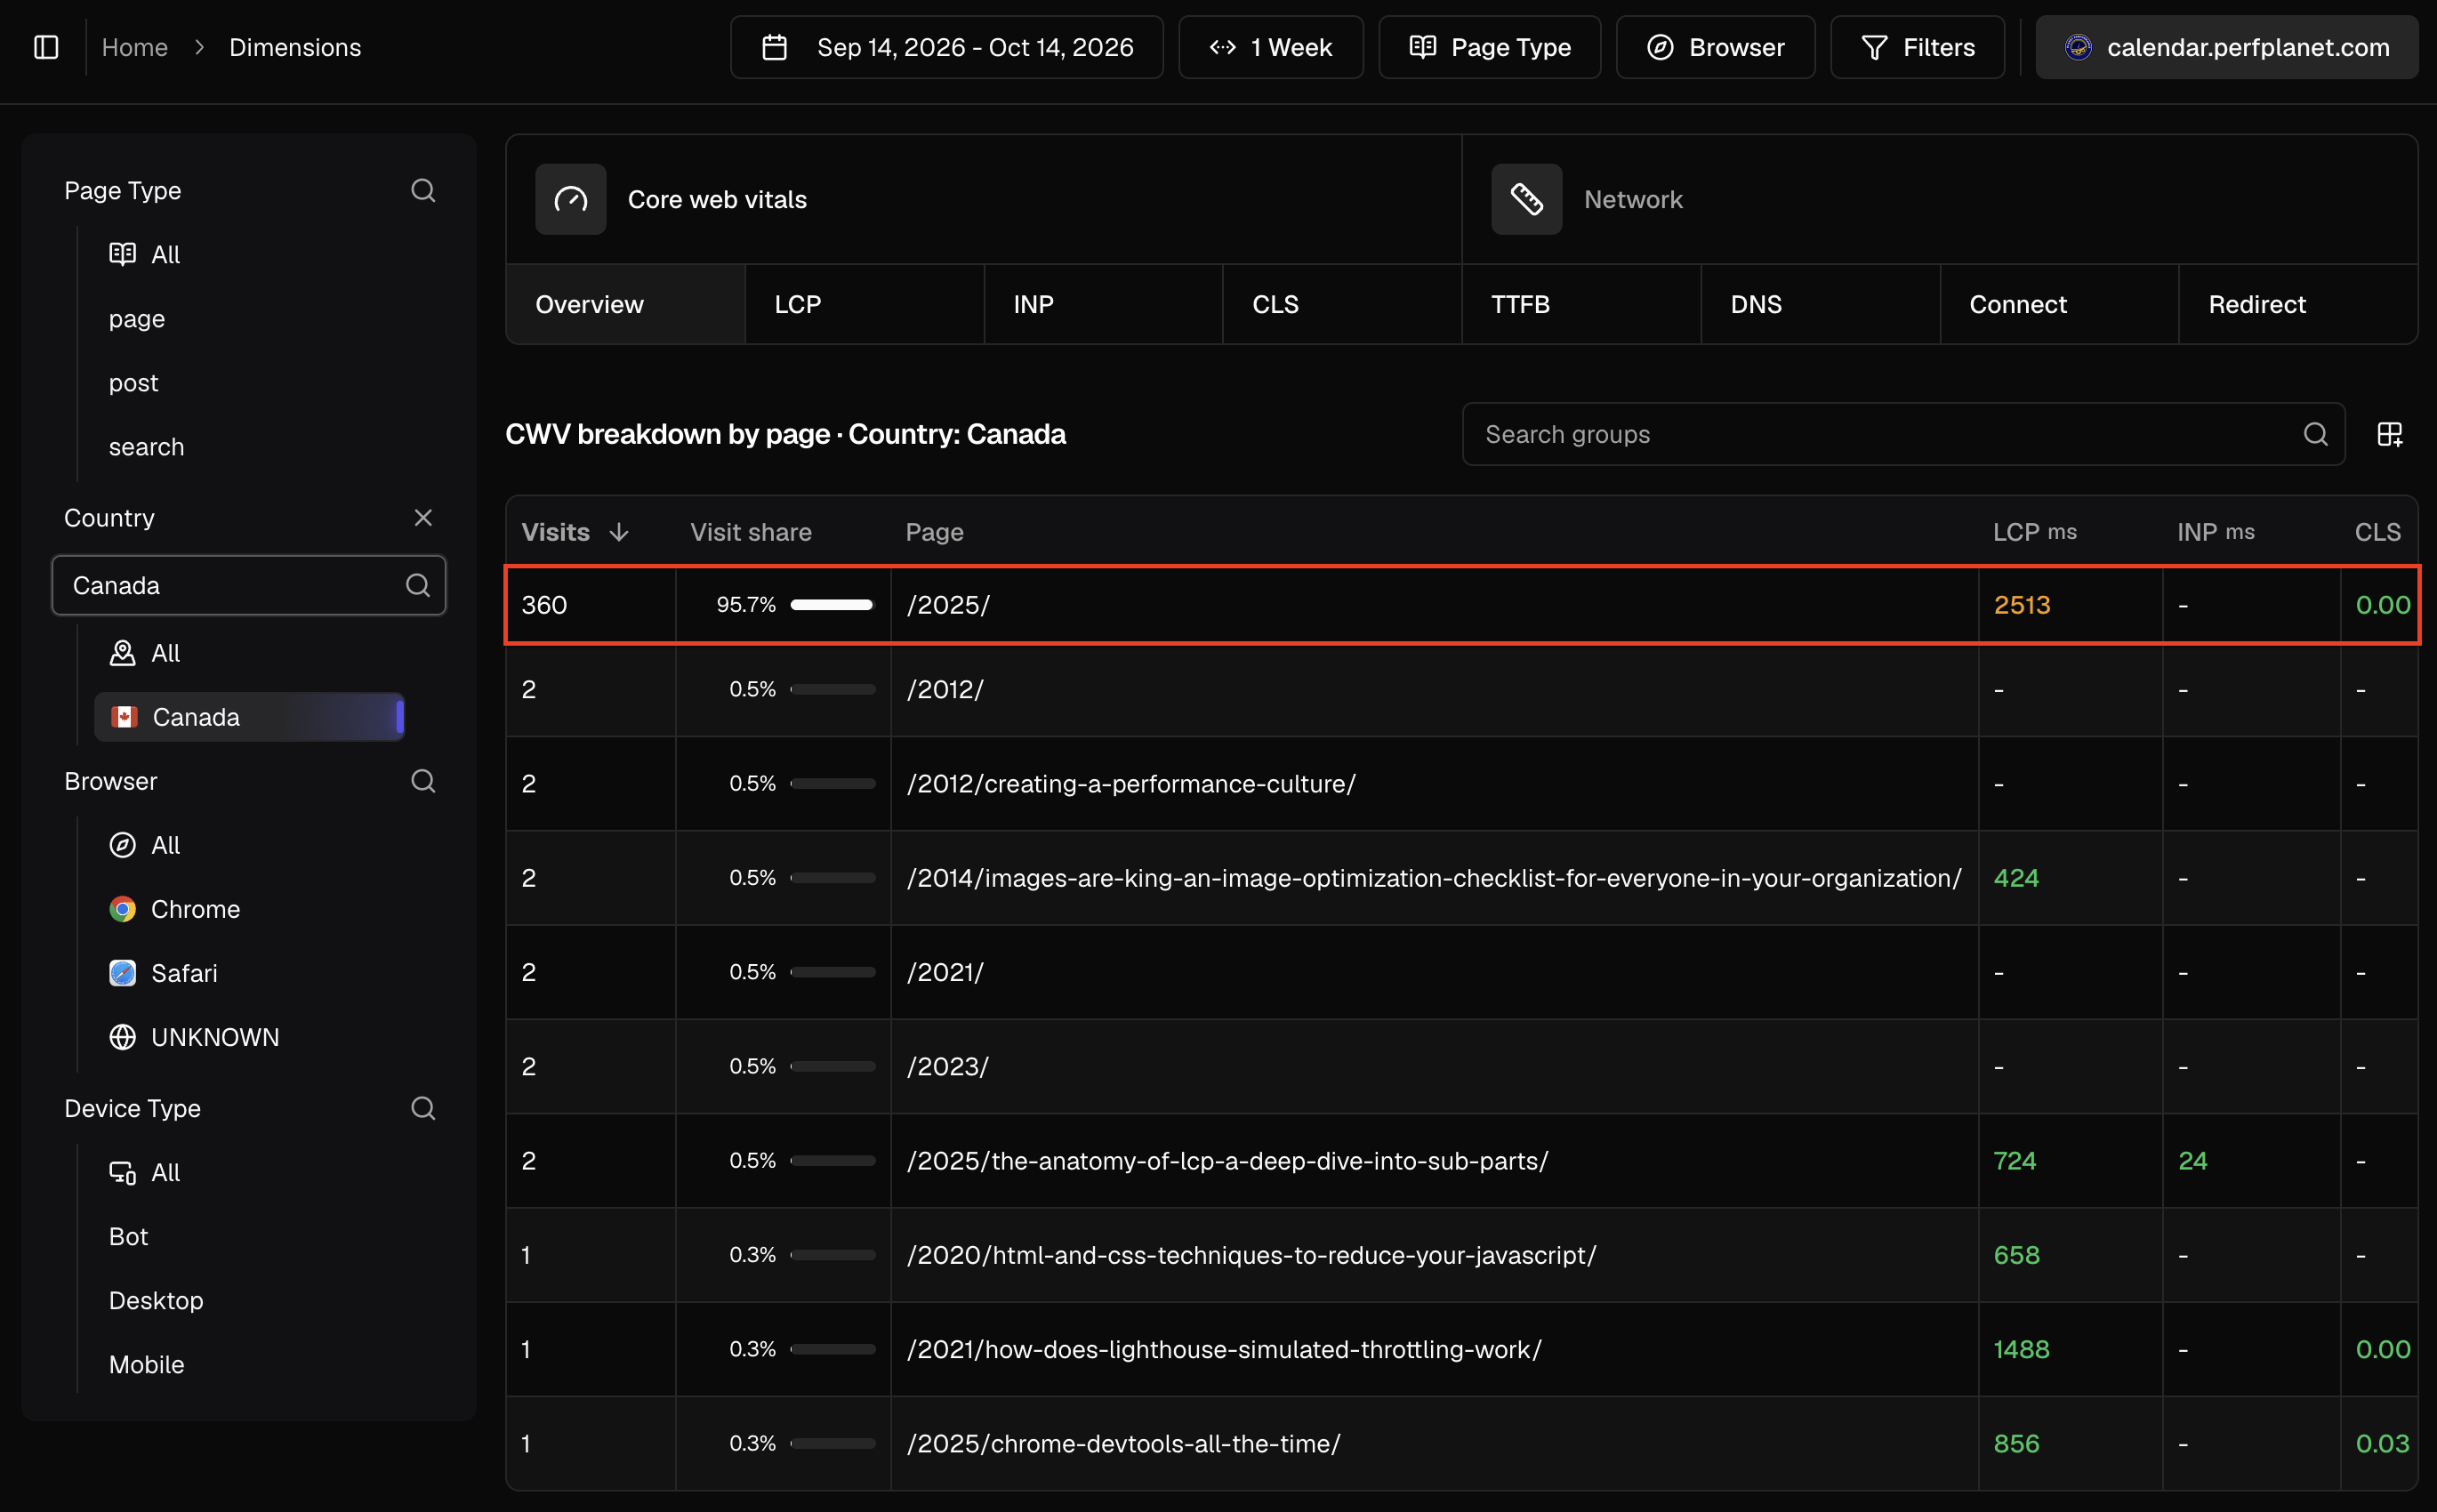
The /2025/ archive receives 95.7% of Canadian visits: a busy page with room to improve, and it’s worth investigating further.
The page’s TTFB at the 75th percentile is 735 ms. This suggests investigating rendering delays next, though it does not rule out slow responses for individual visits.
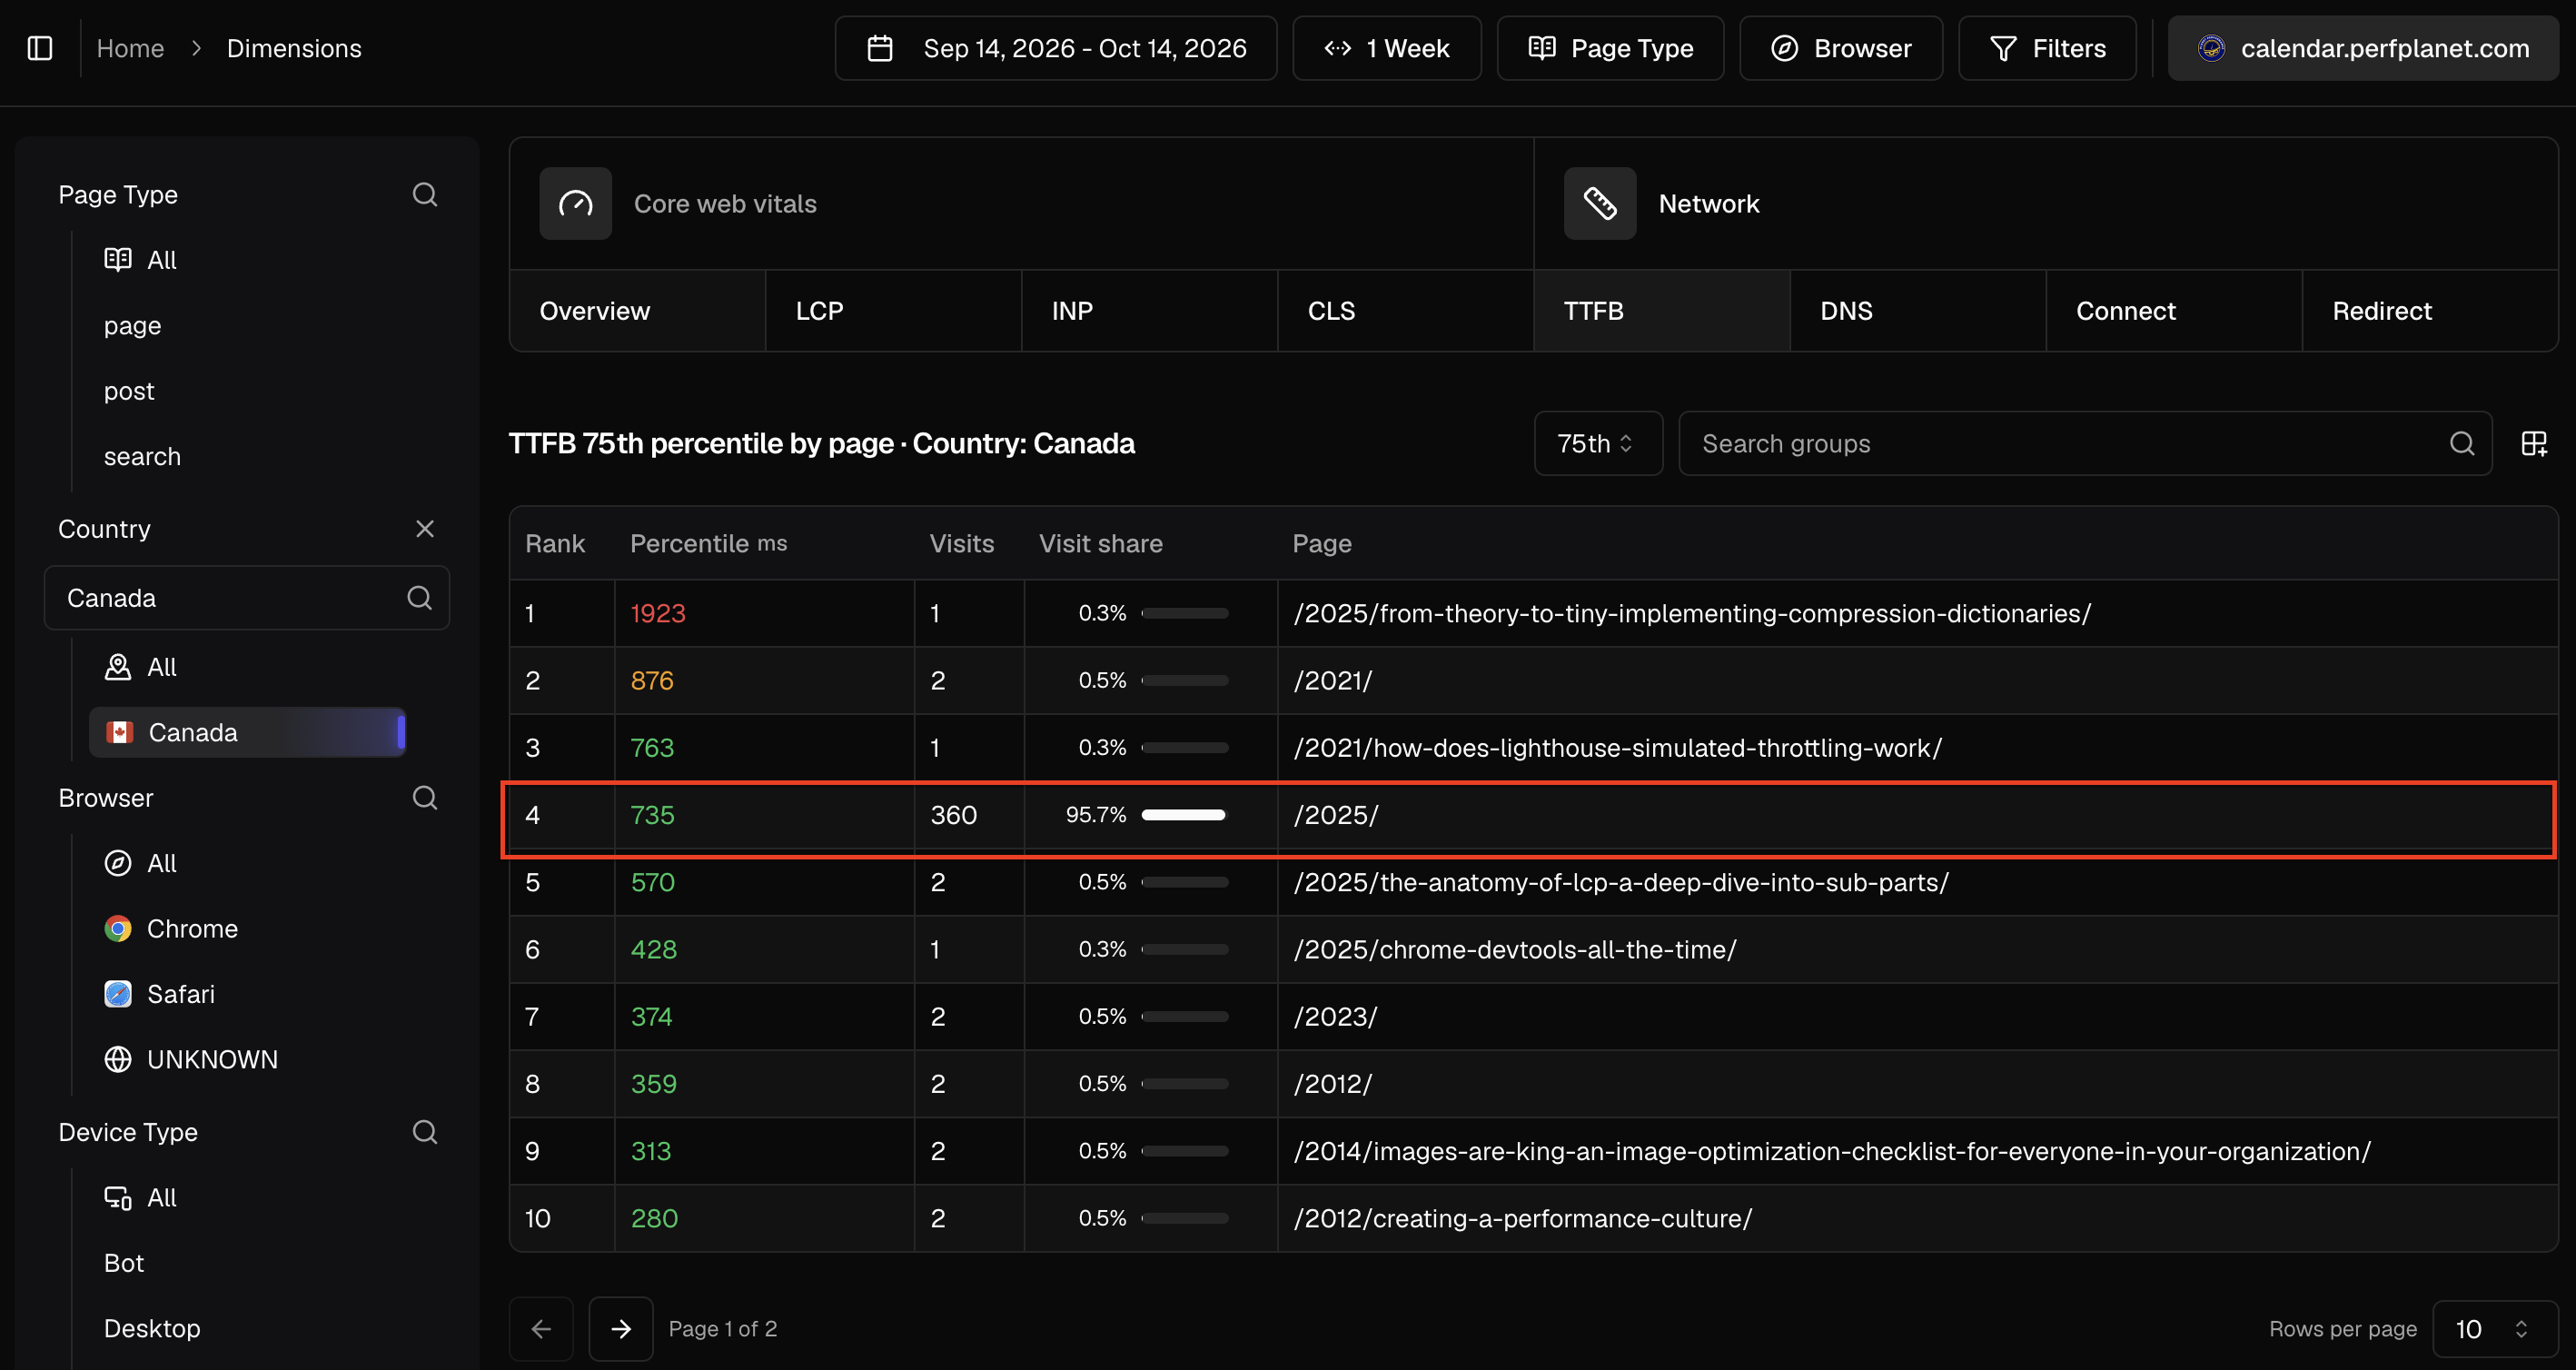
Filtering the /2025/ page by Canada shows that the LCP element needing improvement is a paragraph (<p>) with the CSS selector “div#content div.post.posts-container div.entry.summary p”.
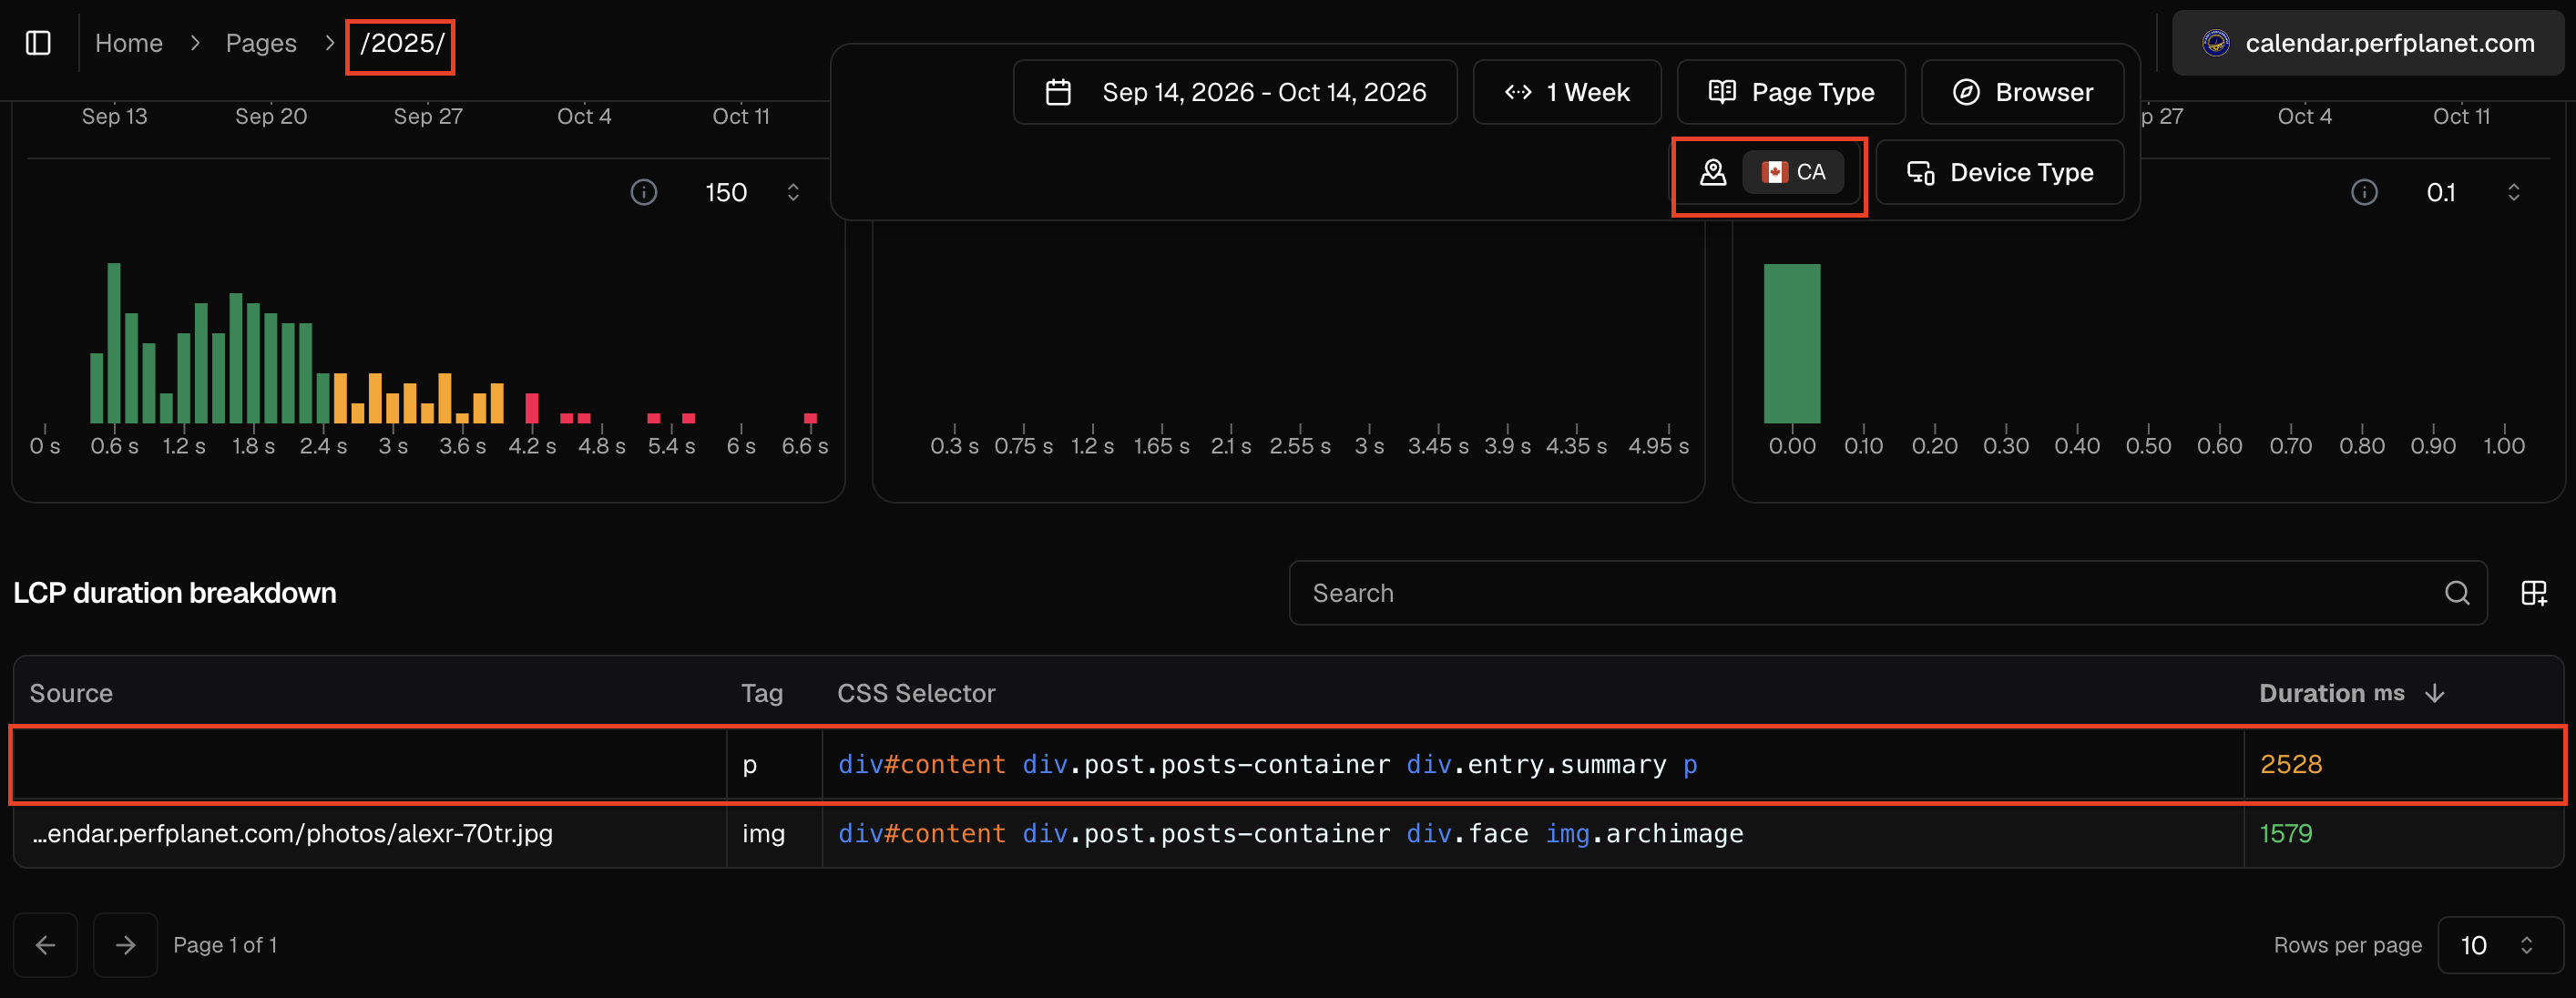
Given the good TTFB, I expected the LCP element to be an image. Usually, when we have good TTFB, the LCP element is an image that needs some extra round trips or gets discovered and fetched pretty late by the browser. I didn’t expect the LCP element to be a P tag. I suspect that there could be something that is causing render blocking. This is the moment when I would probably ask a friend in Canada to load the website and investigate with Chrome DevTools.
Now I have two things to look into: the slow responses in Singapore and what’s delaying the text on /2025/ for visitors in Canada. I don’t know the causes yet, but I know where to start.